
|
|
| articles | forbidden stories I-State Lines resources my hidden history reviews | home | ||

Writing/Film Dear Aspiring Writers: The Worst Advice You'll Ever Read A Literary Look at I-State Lines Spirited Away: Decay and Renewal An American Poem (Robinson Jeffers) Taoist Chinese Poems The Nelson Touch "It's all about oil, isn't it?" Kurosawa's High and Low A Bountiful Mutiny Howl's Moving Castle Thailand's Iron Ladies Trois Colours: Red 9 more in archive Recommended Books American Identity Hapas: The New America Can You Tell What I am? Part I Can You Tell What I am? Part II Only in America Self-Reliance Your Tattoo in 50 Years Cultural Commentaries On Hatred and Anti-Americanism Anti-Americanism Part 2 Anti-Americanism Part 3 French-Bashing Germany: We All Have Problems, But... Kroika! Chronicles This Blog Sells Out Doom and Gloom Sells The Kroika Mascot-"Auspicious Pet" Wal-Mart and Kroika Kroika and Starsbuck Take a Hit Kroika Ad 1 Kroika Ad 2 Kroika Ad 3 Kroika Ad 4 Unfolding Crises: Asia China: An Interim Report Shanghai Postcard 2004 Corruption and Avian Flu: China's Dynamic Duo Exporting the Real Estate Bubble to China Is the Bloom Off the China Rose? China Irony: Steel, Marx & Capital Curing The U.S. and China's Dysfunctional Relationship China and U.S. Inflation Trade with China: Making Out Like a Bandit 8 more Battle for the Soul of America Katrina, Vietnam, Iraq: National Purpose, National Sacrifice Is This a Nation at War? A Nation in Denial Why Is This Such a Tepid Time? That Price Isn't Cheap, It's Subsidized U.S. Fascists Seek Ban on Cancer Vaccine The Truth About Christmas American Dream or American Nightmare? The Most Hated Company in America 2006 Sea Change Obesity and Debt 10 more Financial Meltdown Watch What This Country Needs Is a... Good Recession Are We Entering the Next Age of Turmoil? Doubling Down on 5-Card No-See-Um A Rickety Global House of Cards Are Japan and Germany Truly on the Mend? Unprecedented Risk 2 Could One Rogue Trader Bring Down the Market? Worried about Inflation? Stop Measuring It Economy Great? Bah, Humbug Huge Deficits and Huge Profits: Coincidence? Who's The Largest Exporter? Three Snapshots of the U.S. Economy Loaded for Bear Comparing Nasdaq to Depression-Era Dow Who's Buying Treasury Bonds? And Why? Derivatives: Wall Street Fiddles, Rome Smolders 31 more Planetary Meltdown Watch The Immensity of Global Warming Sun Sets on Skeptics of Global Warming Housing Bubble Watch Charting Unaffordability A Monster of a Housing Bubble A Coup de Grace to the Economy Hidden Costs of the Housing Bubble Housing Bubble? What Bubble? Housing Bubble II Housing Bubble III: Pop! Housing Market Slips Toward Cliff Housing Market Demographics Housing: Catching the Falling Knife Five Stages of the Housing Bubble Derailing the Property Tax Gravy Train Bubbling Property Taxes Have You Checked Your Property Taxes Recently? 4 more Oil/Energy Crises Whither Oil? How much Is a Gallon of Gas Worth? The End of Cheap Oil Natural Gas, Naturally High Arab Oil Money and U.S. Treasuries: Quid Pro Quo? The C.I.A., Oil and the Wisdom of Crowds The Flutter of a Butterfly's Wings? A One-Two Punch to a Glass Jaw 2 more Outside the Box How to Make a Favicon Asian Emoticons In Memoriam: Winky Cosmos The Wheeled Vagabonds Geezer Rock Overload In a Humorous Vein If Only Writers Had Uniforms Opening the Kimono Happiness for Sale: Jank Coffee Ten Guaranteed Predictions for 2010 Design Follies The New Jank Coffee Shop Jank Coffee, Upscale Tropic Style One-Word Titles Complacency Nostalgia Praxis Keys to Affordable Housing U.S. Conservation & China Steve Toma, Me & Skil 77s: 30 years of Labor Real Science in the Bolivian Forest Deforestation and Sustainable Forestry The Solar Economy (book) The Problem with Techno-Fixes I Love Technology, I Hate Technology How To Blow off Web Ads and More 2 more Health, Wealth & Demographics Beauty of the Augmented (Korean) Kind Demographics and War The Healthiest Cold Cereal: Surprise! 900 Miles to the Gallon Are Our Cities Making Us Fat? One Serving of Deception Is Obesity an Inflammatory Response? Demographics & National Bankruptcy The Decline of Europe: A Demographic Done Deal? Are the Risks of Obesity Overstated? Healthcare: Unaffordable Everywhere 1 more Landscapes Selling the Landscape The Downside of Density Building Heights and Arboral Roots Terroir: France & California L.A.: It's About Cheap Oil The Last Redwood Airport Walkabouts Nourishment The French Village Bakery Ideas What Is Happiness? Our Education System: a Factory Metaphor? Understanding Globalization: Braudel Can You Create Creativity? Do Average People Know More Than Their Leaders? On The Impermanence of Work Flattening the Knowledge Curve: The "Googling" Effect Human Bandwidth and Knowledge Iraqi Guangxi Splogs, Blogs and "News" "There is no alternative to being yourself" Is There a Cycle to War? Leisure, Time and Valentines Is the Web a Giant Copy Machine? History The Strolling Bones: Rock of Ages Bad Karma: Election Fraud 1960 Hiroshima: First Use All the Tea in China, All the Ginseng in America Friday Quiz Pet Obesity The Origins of Carbonara Organic Farms Oil and Renewable Energy Human Diseases Wine and Alzheimers Biggest Consumers of Chocolate 7 more Essential Books The Misbehavior of Markets Boiling Point (Global Warming) Our Stolen Future: How We Are Threatening Our Fertility, Intelligence and Survival How We Know What Isn't So Fewer: How the New Demography of Depopulation Will Shape Our Future The Coming Generational Storm: What You Need to Know about America's Economic Future The Third Chimpanzee: The Evolution and Future of the Human Animal The Future of Life Beyond Oil: The View from Hubbert's Peak The Party's Over: Oil, War and the Fate of Industrial Societies The Solar Economy: Renewable Energy for a Sustainable Global Future The Dollar Crisis: Causes, Consequences, Cures Running On Empty: How The Democratic and Republican Parties Are Bankrupting Our Future and What Americans Can Do About It Recommended Books More book reviews Archives: weblog March 2006 weblog February 2006 weblog January 2006 weblog December 2005 weblog November 2005 weblog October 2005 weblog September 2005 weblog August 2005 weblog July 2005 weblog June 2005 weblog May 2005 What's New, 2/03 - 5/05 |
April 29, 2006 The Thin Man: Thoroughly Modern Movies 
Sounds like a script from Oprah's show, doesn't it? Dysfunction, corruption, heavy drinking--it's all here. But the appeal is all in what's not present in today's America. The charmingly natural chemistry between William Powell and Myrna Loy and the sparkling dialog have endeared viewers for decades (as have the antics of their irrepressibly cute dog, Asta) but I have a soft spot for the wonderfully rough-around-the-edges (if not outright seamy) slice of life the films portray: if a suspect mouths off shortly after being collared, he's quickly silenced by a fist in the face (here's yer Miranda rights right here!), and the movies abound with two-bit grifters, gamblers, floozies, shifty characters and ex-cons. Nick Charles has the enviable (and let's face it, wildly improbable) gift of being at ease in both this underworld of human greed, passion and cupidity, and the glittery high-society life the couple inherited from Nora's rich father. One highlight (at least for me) in each film is some accented (Bronx or Brooklyn? I need some guidance here from a New-Yawka) ex-con, who good-naturedly reminds Nick, "Hey, Nick, doncha remember me? Two-bit Charley? Ya sent me up the river, remember? But hey, no hard feelings, you're alright!" Nick, ever so slightly taken aback, nonetheless greets the proletarian ex-con with bonhomie and makes a point of introducing Nora to the ex-con, who inevitably makes a wisecrack along the lines of, "Hey, she's a looker!", allowing Nora to look askance at her all-too-chummy-with-smalltime-hoods husband. The films sport an abundance of class-conscious Depression subtexts. While they enable the audience the escapist pleasures of vicariously sharing the high life of parties, discreet gambling boats and hot jazz clubs, Nick's breezy comfort with lower-class crooks simultaneously inoculates the couple from underclass resentment. You just gotta love Nick, who in classic anti-hero fashion, staves off pressure from both the police and media while giving the hoods who are wrongfully suspected a straight deal. He is, in other words, the personification of noblesse oblige: the embodiment of all the noble characteristics that the nation sought in the privileged class. (The role of film is, after all, to make fantasy real.) Most amazingly, the film takes the old, hackeyed gambit of assembling all the suspects into one room for the hero-detective to pick apart and makes it work, both as drama and as comedy. Beefy cops don ill-fitting waiters outfits and roughly shove recalcitrant suspects into their dining chairs ("You're not gonna pin this on me, copper!" etc.) The fancy dinner-party mis-en-scene sets up one of Nora's best lines: "Waiter, serve the nuts. (pregnant pause). I mean, serve the nuts to the guests." The Thin Man is both the epitome of and the template for sophisticated mystery-comedies, a lighter-than-air souffle of class pretensions deflated, seamy villany exposed and a constantly inebriated anti-hero who nonetheless is sharp as a tack when it comes to nailing the evil-doer or countering his adorable mate's witty barbs. Oh, and the thin man is thin--and so is Nora. Since the couple is always impeccably dressed, it's hard not to notice that they look great. Was this a reflection of starvation diets and punishing workouts, or simply a time before fattening junk food stealthily conquered America? I would peg Nick's BMI (body mass index) at about 22. (Normal is 18.5 to 25.) If you're curious about your own BMI, calculate it here. (and no fibbing; Nick don't approve of no cheating.) April 28, 2006 Friday Quiz: Where Is This? 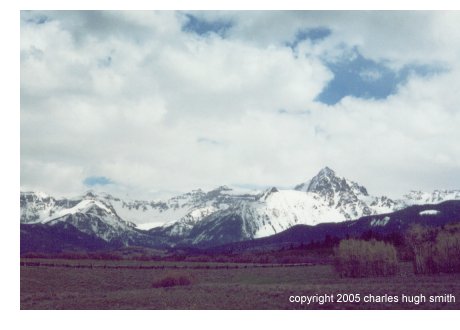
'62 Dodge Lancer, the Friday Quiz is yet again on the wondrous American landscape. I'll ship a copy of my book to the first person who emails in the most accurate guess. (The first two American Landscape quizes drew quick responses, and the well-traveled winners will get their free copy as soon as I get my books from the publisher. Unfortunately, the printer messed up so the books won't be shipped until next week.) Since this photo could be from a number of places (hint 1: this isn't in California), just identifying the state and highway will be plenty good enough to win. (Hint 2: this photo was taken around the middle of May, on a multi-state camping trip.) This is a state which the book's two young guys certainly visit; they're camping there when they meet a retired Marine Colonel and his wife, who feeds the guys their first decent meal in days. I thought so highly of this amazing scenery that I had this photo included on the cover of I-State Lines. So please take a guess, and Good luck! April 27, 2006 Why My Book Is Better Than The DaVinci Code (tongue firmly in cheek)  Herewith are the reasons why my book I-State
Lines is better than Dan Brown's runaway mega-hit bestseller, The DaVinci Code:
Herewith are the reasons why my book I-State
Lines is better than Dan Brown's runaway mega-hit bestseller, The DaVinci Code:
1. Mine is shorter. Hey, time is at a premium, and shorter books are by definition faster reads, right? So you've got more time for TV, wondering why your flight's delayed, etc. 2. Mine is less exciting. With a page-turner like DaVinci, you might get a heart attack or break out into a cold sweat. With I-State Lines, there's no albino assassins, or even tanned assassins, or green-eyed beautiful cryptology experts. So in other words, it's boring and therefore safe. You won't get overly stimulated. 
4. Mine actually has a real cryptogram for you to solve. OK, not the book, but the online contest about the book. Not only that, but the ISL contest actually references Kryptos, which will only figure in Dan Brown's next book. So why wait for his next thriller when you can wonder what the heck Kryptos is right here on the ISL website? Not only that, but if you're the first person to solve the ISL crypto-puzzle, you win two free roundtrip bus tickets across the U.S. of A.! (No purchase is necessary, but hopefully you'll wonder what all the fuss is about and plunk down $13 for the book.) 5. My character's names are better. I'm not saying Sophie and Robert are bad names, but come on, aren't Daz and Alex punchier? 6. Tom Hanks will not be wearing a mullet in the ISL movie. Heck, Tom Hanks won't even be in the ISL movie, because there is no such thing. But even if there were, it wouldn't attract such a talented big-name star like Tom Hanks. But really, don't you think it's a blessing that you won't have to see Tom Hanks with a mullet 'do in an ISL movie? 7. I have a better middle name. Admittedly, it's a draw between Brown and Smith, but "Hugh" is a better middle name than whatever Dan's is. (Please don't disagree or you'll hurt my Dad's feelings, as Hugh is his given name.) 8. Having a smart old codger murdered in the Louvre by an albino assassin is such a cliche beginning; practically every thriller has guys getting bumped off in the Louvre by albino assassins. Some meet their Maker in the African Art section (the bejeweled dagger in the heart cliche), others get the ancient Roman spear through the gullet, and yet others expire with a ninja star in their backside, splayed out in the East Asian collection. I-State Lines starts with the guys getting kicked off a bus on a melt-lead day on the way to Liberty, Iowa. How many thrillers can you name with that intro? OK, so ISL isn't a thriller, it's more of a snoozer, but still, isn't it refreshing to find a book which doesn't start with mayhem at the hands of yet another albino assassin? 9. I-State Lines is cooler than TDC because it's unknown. Real unknown. How cool is it to be reading the same book as everyone else in the airport? That is so not cool, dude, it's almost like showing up for the same party wearing the same torn faded jeans as everyone else. We all know that what's cool is by definition not known to anyone but the in-crowd. Remember when those clunky Doc Martens shoes were so out that suddenly they were the shoe of choice for Manhattan and Santa Monica hipsters? We both know that ISL isn't cool, it's just unknown, but your friends don't know that. They'll look at you with green-eyed envy (especially if they're a beautiful cryptologist by the name of Sophie) and think, "Woah, I had no idea that they were so on top of the hip lit scene! They are so totally awesome and brilliant and cool!" OK, maybe they won't be thinking that when you walk by, reading I-State Lines, but they may be thinking it. So why not imagine them thinking it? That's as good as them actually thinking it! 10. ISL fits in better with your "special-Friday-deals" stuff you just bought on Amazon.com. You know how amazon has those amazing special deals every week on everything from DVD players to towels? Well, ISL is thin and flexible, and the $13 price tag will get you over $25 so shipping is free. Meanwhile, TDC is sort of bulky and may take up space better left for the other goodies you're buying at huge discounts. 11. ISL has much better slang than TDC. It would be strat if you spent some gitas on my book, and believe me, you'll find it very tropo-electric to use words from ISL because your smart-aleck know-it-all teenagers will be (1) confused and then (2) massively jealous that you're using cooler slang than they are. 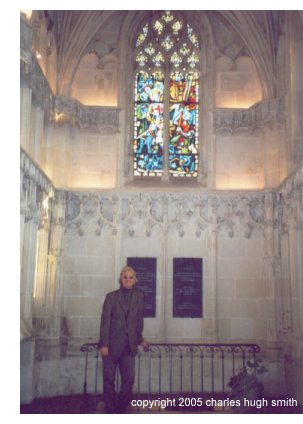 12. The books around ISL's Amazon ranking (870,999) are much worthier than the titles
hanging around TDC (37). For example: Like a Bullet of Light : The Films of Bob Dylan
(871,003), How To Be Twice As Smart (870,994), Mastering Foreign Exchange and Money Markets
(870,995), The Painted Word by Tom Wolfe (870,992) (a witty sendup of modern art, I recommend
it), Great American Bridges and Dams (870,976), Teaching Your Child to Cope with Crisis (870,977)--
you get the idea. Here is variety, quality and depth, while way up at 37, let's face it, it's
the dregs! Lachrymose tales of abuse and phony redemption, or maybe it's the abuse which is
phony, who can even tell? 871,000 is where the quality is, and I invite you to check it out.
12. The books around ISL's Amazon ranking (870,999) are much worthier than the titles
hanging around TDC (37). For example: Like a Bullet of Light : The Films of Bob Dylan
(871,003), How To Be Twice As Smart (870,994), Mastering Foreign Exchange and Money Markets
(870,995), The Painted Word by Tom Wolfe (870,992) (a witty sendup of modern art, I recommend
it), Great American Bridges and Dams (870,976), Teaching Your Child to Cope with Crisis (870,977)--
you get the idea. Here is variety, quality and depth, while way up at 37, let's face it, it's
the dregs! Lachrymose tales of abuse and phony redemption, or maybe it's the abuse which is
phony, who can even tell? 871,000 is where the quality is, and I invite you to check it out.
"Baker's dozen" reason 13: I know where Leonardo is buried. (I snapped this photo of my brother in Leo's tomb last year.) Would I be cheap and gaudy enough to put this sort of thing in I-State Lines, to try to get you to read the book for its exotic locales, mysteries and fast-paced action? Heck no. ISL is set in the U.S., in places you won't find in Dan Brown thrillers, places like Las Cruces, New Mexico. Great place, I recommend it. If something funny or romantic or memorable is gonna happen to you, have it happen in Las Cruces, not the Louvre. Sure, the I.M. Pei pyramid is fun (hot in summer, though), but the crowds are pitiless and there's no comfortable places to sit down. Plus, an albino assassin might take you out. Believe me, there are more intimate, much less crowded museums in Paris, and while you might get assassinated in one, it wouldn't be by a run-of-the-mill albino. Am I begging you to buy my book? No. I would if I could, but you're too savvy and erudite to be convinced by begging. So here are the reasons, all 13 of 'em. Thank you for reading this all the way to the end; I hope it wasn't too painfully obvious that Dan Brown is a much-lauded multimillionaire and I am a poor, dumb unknown slob with a snowball's chance in Heck of rising to 370,000, much less 37,000, on amazon's ranking. But, hey, it's all good. April 26, 2006 Foreclosures and Financial Ruin: How Bad Will It Get? As stories of rising foreclosures become commonplace, one question comes to the fore: how bad will it get? A good place to start looking for answers is the government agencies tasked with safeguarding both depositors and lenders: the well-known guarantor of bank deposits, the Federal Deposit Insurance Corporation (FDIC), and one of the most obscure agencies within the Federal Government, the U.S. Treasury's Office of Thrift Supervision (OTS). Just to give you an idea of these agencies' research, consider this report from the FDIC: Scenarios for the Next U.S. Recession. Here's a very interesting chart from the report: 
* * * * * * * * * * * * * * * * * * * * * Here's what the graph says in simple terms: only 74% of U.S. households are above the poverty line, and 69.1% are homeowners. In other words, just about everyone who has a paycheck above poverty level has bought a house. Homeownership, remarkably stable for years at 64%, suddenly leaped to 69.1% in the past 10 years. And who were those buyers? People who could not have qualified for a mortgage before standards were lowered. This revelation reminds me of the Vietnam-era draft. When the Pentagon needed warm bodies, standards dropped to near zero. At my pre-induction physical in 1972, they were basically checking to see if you had four limbs and could walk upright. If so, you were good to go. The same cursory standards have been applied to mortgages for the past few years, with the predictable result that poor risks are turning out to be, well, poor risks. As the Denver Post recently reported: "We made it easy for people to buy houses and difficult for them to hold onto them," said Tom Clark, an executive vice president with the Metro Denver Economic Development Corp. One out of 128 homes in Adams County is in foreclosure, nearly nine times the national ratio.The FDIC staff reckons 10% of consumers will experience a "recession" (a polite term, apparently, for losing your home and/or suffering complete financial ruin). But as the Post article notes, a rising wind of foreclosures generates its own downdrafts. That rather obvious feedback loop has ominous overtones, so the FDIC staff set out to prove all was well with a report entitled U.S. Home Prices: Does Bust Always Follow Boom? The FDIC, predictably, concluded that busts were uncommon; but their chart reveals an unmistakably unprecedented housing bubble has formed in the past five years: 
* * * * * * * * * * * * * * * * * * * * * * * The body of the report reaches the same conclusion--that housing has leaped far above inflation and rents: U.S. average home prices rose by almost 11 percent in 2004. Adjusted for inflation, the price of the average home in the sample increased by 8 percent–the fastest pace recorded in 30 years. Last year, home prices rose 11 percent, but rents only increased by 2.7 percent nationwide. In 2003, the 7 percent gain in home prices also outstripped a 2.4 percent gain in rents.If that doesn't define a bubble, then what does? Once upon a time, the NSA (National Security Agency) was such a closely guarded secret that even its very existence and name were secret. The OTS reminds us that obscure (and not even secret) agencies wield all sorts of arcane power--for instance, the Office of Thrift Supervision, which, as far as I can gather, is tasked with establishing the risks faced by mortgage lenders ("thrifts"). Reader Jon O., whose powers of financial analysis far exceed my own, sent me these links to Office of Thrift Supervision's Statistical Releases, and suggested I check out what risks the OTS foresaw should a "rate shock" (i.e. an increase in mortgage rates) occur. Toward this end, I read the Quarterly Review of Interest Rate Risk he sent along and found these fascinating comments: "The third quarter saw the ARM (adjustable rate mortgage) share of total mortgage originations rise to 43%... The number of thrifts with significant or high interest rate risk rose to 23 in the 3rd quarter, up from 16 the prior quarter."  This number is not a big deal when you consider they found 666 (a highly ominous number) thrifts to be low risk,
but it's still a 50% increase in only one quarter.
This number is not a big deal when you consider they found 666 (a highly ominous number) thrifts to be low risk,
but it's still a 50% increase in only one quarter.
But the truly salient point is that almost half of all recent mortgages are adjustable rate loans, meaning that the people who took on these mortgages will be fully exposed to higher rates via future resets. As I asked in yesterday's entry: what happens if rates rise from 5.5% to 8.5% or even 10%? Mortgage payments rise--a lot. But that's just the damage rising rates will wreak on homeowners. Rising rates will devastate lenders, too. The OTS is forecasting that lenders' Net Portfolio Value (NPV) will drop by 30% if interest rates rise 300 basis points (3%). Well, the rates are already up nearly a point in less than a year; in the OTS estimation, lenders' portfolios have already dropped 8% in value. Why do we care? Because as lenders' assets drop, they get nervous about taking on new loans. And their trigger fingers get real itchy when it comes to dumping foreclosed properties. As the accompanying chart reveals, massive numbers of thrifts have failed in recent history. The financial cheerleaders are quick to reassure you that such a calamity can never happen again, but if you examine the evidence, such reassurances suddenly sound awfully thin. For one final bit of evidence, read this excerpt from Barron's 1/20/06 issue: Some 43% of first-time buyers, David Rosenberg of Merrill Lynch recounts, put zero money down on their home purchases last year; by contrast, two years earlier, 28% bought a house with no down payment. Well over a quarter of the mortgages in '05 were of the dicey "buy now, pay later" variety.So let's summarize: the number of risky thrifts is rising rapidly; rising interest rates sap the value of the thrifts' portfolios, pushing them into the "risky" column; almost half of all recent mortgages are adjustable, meaning homeowners are hugely at risk of rising interest rates, and to cap off the entire house of cards, over 40% of recent home buyers put no money down. If all that doesn't add up to high risk, then what else do you need? Oil at $70 a barrel? $400 billion Federal deficits? A waning foreign appetite for U.S. bonds? An $800 billion trade deficit? By strange coincidence, we got 'em all. April 25, 2006 The Housing - Inflation Connection One little-understood result of the housing bubble is its massive distortion of the Consumer Price Index, i.e. the rate of inflation. Why is this important? Let's start with an example.  Let's say Joe and Suzie Citizen bought a house in 2004 which they'd previously rented
for $1,500 a month. Their mortgage, insurance and property taxes total $2,500.
The effect on the CPI of the extra $1,000 a month? $0
Let's say Joe and Suzie Citizen bought a house in 2004 which they'd previously rented
for $1,500 a month. Their mortgage, insurance and property taxes total $2,500.
The effect on the CPI of the extra $1,000 a month? $0
Let's say Suzie's folks' house just got re-appraised, and thanks to the housing bubble, their property tax bill is 40% higher--about a $1,000 more a year. (If you think this sounds high, think again). The effect of this higher property tax payment on the CPI? $0. Let's say Joe and Suzie's neighbor was one of the 25% of buyers who bought their house with an exotic "interest-only," low-interest rate mortgage back in 2003. His mortgage has just been reset from 4.5% to 7.5%, causing his mortgage payment to rise by over $1,000 a month. The effect on the CPI of the extra $1,000 a month? $0 Wait a minute. You mean these huge rises in housing expenses have zero effect on inflation? How is that possible? As Alan Abelson explained in a May 30, 2005 Barron's column: Shelter, you see, which accounts for about 30% of the core CPI is measured not by the dictates of the marketplace, how much houses actually fetch when they're sold, but by a strange -- make that perverse -- yardstick called owners' equivalent rent. Homeowners are asked how much they think they could get were they to rent their abodes.In one important sense, money is a commodity like any other. The cost of money --that is, the cost of borrowing money--rises and falls, just like the costs of other commodities. When the cost drops--when interest rates fall--then that has a deflationary effect on the CPI. You get the same good or service for less money. Conversely, when interest rates rise--as they are now--then they have an inflationary effect. You're paying more for the exact same service/good--in this case, your house. But in the current CPI calculation, the actual costs for 70% of the population--homeowners--is completely ignored in favor of "market rate" rents. Here are the numbers used to figure the CPI (taken from the Bureau of Labor Statistics abstract titled why inflation as stated in CPI doesn't match your reality:) Expenditure category --------------------------------- Food and beverages 15.7 Housing 40.9 Apparel 4.4 Transportation 17.1 Medical care 5.8 Recreation 6.0 Education/communication 5.8 Other goods & services 4.3 --------------------------------- Total, all items 100.0  The BLS website provides this detailed explanation of the housing component of CPI:
rent and owner's equivalent rent. Basically, the BLS says that rents are far more stable
a measure than mortgage rates, which rise and fall to a much greater degree than rents. While
this makes sense, it ignores the fact that only 30% of the citizenry rent, and that
most of those renters are in the lower income brackets. Most renters simply cannot
afford to buy a house; this means that rents can only rise as fast as renters' incomes--
and income for most American workers has been flat for the past 5 years.
The BLS website provides this detailed explanation of the housing component of CPI:
rent and owner's equivalent rent. Basically, the BLS says that rents are far more stable
a measure than mortgage rates, which rise and fall to a much greater degree than rents. While
this makes sense, it ignores the fact that only 30% of the citizenry rent, and that
most of those renters are in the lower income brackets. Most renters simply cannot
afford to buy a house; this means that rents can only rise as fast as renters' incomes--
and income for most American workers has been flat for the past 5 years.
For more on the 34 million renters in the U.S., please read this report by Joint Center for Housing Studies of Harvard University: America's Rental Housing. (Note: this is a large PDF file which may take some time to load if you have a dialup Internet connection.) The report notes that 3 million units of rental housing were constructed from 1993-2003, even as the number of renters held steady at 34 million. In other words, homeownership increased, and the supply of rental housing exceeds the demand--the classic formula for keeping rents low. As you can see, Abelson underestimated the role of housing in the CPI--it's actually over 40%. (To find the official rate of inflation for any year or series of years, go to the BLS website and select the "inflation calculator" in the upper left heading.) So what does all this mean in the real world? Just this: the official inflation rate has grossly miscalculated the true costs of the nation's housing. As house values leapt above their historic ratio to rents, as property taxes have skyrocketed, as mortgage rates have risen, as mortgage resets dramatically raise millions of household's expenses--the CPI reflects nothing but rents which are depressed by massive overbuilding. Here is an CNN/Money article on the issue: Double jeopardy for landlords; "Slowing housing prices and a stagnant rental market have landlords squeezed from both sides." But despite this gross mis-reporting of actual housing expenses, inflation is beginning to rise--with enormous consequences for the U.S. economy and the housing market. 
* * * * * * * * * * * * * * * * * * * * * * * * * * * * * * * * Why? Because we depend on foreigners to buy our Treasury bonds and the trillions of dollars of mortgage-backed securities which have enabled low mortgage rates. Once inflation is perceived as being 5% (never mind it's probably 6-7%), who in their right mind would buy a mortgage-backed security paying 6%? And we all know what's been propping up the bubble--low interest rates. Though most home buyers are unaware of it, their mortgage rate isn't set by the Federal Reserve--it's set by the bond market. And once the bond market grasps that the actual rate of inflation far exceeds the official rate, then mortgage rates will rise. How high? Historically, bond buyers expect at least 2% above inflation, though 3 or 4% is typical. If inflation is actually running at 6%, then a mortgage rate of 10% would be well within historical norms. And what would a 10% mortgage rate do to housing values? We all know the answer. April 24, 2006 Dread Disease Shelterus Bubbleria Sweeps the Nation!  It is my sad duty to convey the ravages of the dreaded disease Shelterus Bubbleria
across our fair land.
It is my sad duty to convey the ravages of the dreaded disease Shelterus Bubbleria
across our fair land.
As you can see from the accompanying maps, this subtle but debilitating disease has spread in a classic pattern. The first outbreak occurred 15 years ago in geographically isolated Hawaii. Scientists have definitively linked Hawaiiana Shelterus Bubbleria to Japanicus Bubbleria, which exploded across Japan in the late 1980s and was carried to Hawaii by exuberant Japanese investors. The disease seemed to die out by the mid-1990s, but as with many other insidious pathogens, its seeming disappearance only set up a far more devastating outbreak in the San Francisco Bay Area in 1998. Genetic testing suggests that this new virulent strain "jumped" from either the then out-of-control infection Nasdaqus Bubbleria or its local stubbornly resistant variant, Siliconvallus Bubbleria.  As in other outbreaks of Bubbleria, euphoric investors provided the perfect
disease-carrying vector. As symptomatic greed invaded the hosts, they quickly carried
the pathogen to other urban centers--Los Angeles, Miami, and of
course the site of previous outbreaks of Bubbleria, New York.
As in other outbreaks of Bubbleria, euphoric investors provided the perfect
disease-carrying vector. As symptomatic greed invaded the hosts, they quickly carried
the pathogen to other urban centers--Los Angeles, Miami, and of
course the site of previous outbreaks of Bubbleria, New York.
Ironically, the horrifyingly costly die-off of Nasdaqus Bubbleria in 2000-01 only seemed to hasten the spread of its infectious cousin, Shelterus Bubbleria, from urban centers to smaller cities and suburbs.  All too soon, residents in these once-pristine areas began noticing the unmistakable symptoms in their friends and
neighbors: shortness of breath when viewing the Sunday Real Estate section, sweaty,
rapt attention focused on tales of rapidly rising home values, an overpowering urge to join
the rush to "easy, guaranteed riches," and a sudden, distressingly habitual drive to re-calculate
property values, mortgage refinance packages and home equity lines of credit offers.
All too soon, residents in these once-pristine areas began noticing the unmistakable symptoms in their friends and
neighbors: shortness of breath when viewing the Sunday Real Estate section, sweaty,
rapt attention focused on tales of rapidly rising home values, an overpowering urge to join
the rush to "easy, guaranteed riches," and a sudden, distressingly habitual drive to re-calculate
property values, mortgage refinance packages and home equity lines of credit offers.
As we now know in chilling detail, the disease soon drove its victims to the depths of fiscal insanity, prompting them to buy multiple properties with no money down, signing frighteningly risky interest-only adjustable mortgages with abandon.  The crueler aspects of the disease can be observed in its final, culminating phase.
Victims feel an overpowering urge to become realtors or mortgage brokers, and their initial
success in flipping properties balloons into a godlike faith in their own genius and/or the
inevitability of a permanent, never-ending real estate boom.
The crueler aspects of the disease can be observed in its final, culminating phase.
Victims feel an overpowering urge to become realtors or mortgage brokers, and their initial
success in flipping properties balloons into a godlike faith in their own genius and/or the
inevitability of a permanent, never-ending real estate boom.
Now that the disease has spread its tenacles into every community in America save New Orleans, the true costs of this epidemic are finally becoming clear. The appallingly subtle march of the disease continues, even as it has begun burning out in "hot spots" like South Florida. Banks are offering "tranches" of interest-only and principle-only bond derivatives to disease-afflicted investors, raising the risks from mere foreclosures to potentially system-wide financial collapse. As victims awaken, as if from a wild, nonsensical nightmare, they are stunned to find that they own six houses they've never seen in places ranging from Kansas to Phoenix, AZ, and that as their "investments" sit unrented and unsold, they are facing huge negative cash-flows each and every month. Just as they are grasping the depths of their brief but debilitating insanity, they get notification that their interest-only adjustable loans are due to reset to much higher payments. Sadly, the most pernicious manifestation of Shelterus Bubbleria only appears at the very end of the disease's run. The hapless victims, still deprived of common sense by the illness, put all their hopes on "waiting out this flat spot in the market," thereby guaranteeing their eventual financial destruction. Though various inoculations have been tried, there seems to be no cure for Shelterus Bubbleria. It must run its course, leaving millions distraught and bankrupted in its wake. Are you a skeptic of the housing bubble? Good! Skepticism is always warranted. But please read the following entries before making up your mind that it's balderhash: Charting Unaffordability A Monster of a Housing Bubble A Coup de Grace to the Economy Housing Market Demographics Housing: Catching the Falling Knife Five Stages of the Housing Bubble Derailing the Property Tax Gravy Train Bubbling Property Taxes Have You Checked Your Property Taxes Recently? April 22, 2006 Fake Ads and Reader Feedback Did you see the Luna-Incubus ad parody on Thursday? A close friend and loyal reader didn't even glance at it, automatically dismissing it a "real" ad. This was high praise, indeed, and my friend opined that other readers may have missed the parody as well. So please scroll down and read the ad for the wondrous "twin butterflies" drug, Luna-Incubus. Reader Bill B. did catch the ad, and wrote: Hey Mr. Smith, I am writing to say that I enjoy your blog. It’s very professional and you always have interesting data to support your points. I think today’s post on AMERICA’S PRESCRIPTION DRUG CULTURE is spot on. My wife and I rarely watch the evening news, but when we do we are amazed at the barrage of advertisements for drugs. RESTLESS LEG SYNDROME???? Gimme a break! I’m sure you’ve read BRAVE NEW WORLD: I WILL NOT TAKE SOMA…EVER. Anyway, thanks again for your work, I enjoy it.Thank you, Bill, for the kind comments, and I am honored by your praise. Judging by the thousands of hits my recent entries on property taxes have received, many of you share my concerns about this "stealth" issue. Reader Kathy K. writes: I enjoyed your article(s) regarding property taxes and the housing bubble. I've been wondering about this problem for some time. The subject doesn't seem to come up much and it's an important issue.Reader Sue V. sent in these excellent points: 1. Excellent overview of the property tax situation. I have a friend who has a small business doing research at the San Mateo County Recorder's in Redwood City. When he has a little downtime, he sometimes helps people off the street who want to look up property information and don't know how to navigate the computer. He says it's shocking to these folks just how many extra taxes, fees, bond measures and the like are added to a piece of property. It's shocking to him that they can vote and can still be that ignorant. 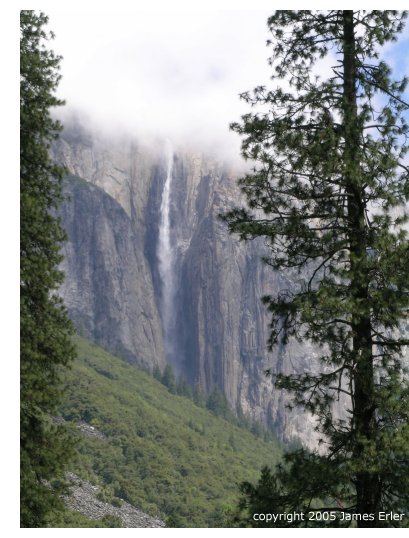 I am honored to have such astute and witty readers. I have some other excellent
information to share next week provided by other readers--Jon O. on the Office of Thrift
Supervision and Charlie R. on solutions for our failing health care system.
I am honored to have such astute and witty readers. I have some other excellent
information to share next week provided by other readers--Jon O. on the Office of Thrift
Supervision and Charlie R. on solutions for our failing health care system.
The Friday Quiz prize goes to Wayne S., who went with Great Sand Dunes near Alamosa, Colorado. The Friday photo was taken in White Sands, New Mexico, but I have to say the photo was a poor one in the sense that it contained no markers which were unique to White Sands and not to the Great Sand Dunes. So Wayne wins the prize--OK, it's only a copy of my book I-State Lines--but the point is, I'm still learning how to pick decent photos for the Friday Quiz, so please suffer with me as I improve the selection. As a consolation to all readers, here is a great shot of Yosemite taken by my buddy Jim Erler on a hike we took there last year. Oh, and as for ads--since I don't accept ads, every ad you see here is a fake. Hopefully an artful one, but a fake one nonetheless. April 21, 2006 Friday Quiz: Where Is This? 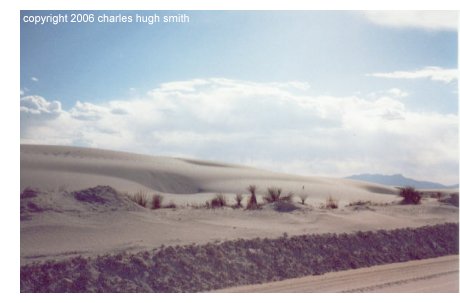
Some of the places will be spots the two young fictional characters visit; others will have no relation to the book other than the exploration of America. (The guys may have driven past this site and just not mentioned it; they were certainly in the area.) The book is not just a semi-random exploration of the American landscape, but of American identity and all those things of pressing importance to youth: freedom, friendship, sacrifice, love. So is it a DaVinci Code knockoff? No way! It's about the mysteries of America, and two young guys in an old car not afraid of the future. Clearly, this is a desert. But which one? And where? (Hint: it isn't in California, nor is it Death Valley.) I'll ship a copy of my book to the first person who emails in the most accurate response. (Naming the state isn't close enough; it must be a town, the closest proximate town, or the name of the locale, should it have a name found on maps.) Good luck! April 20, 2006 Medication Nation I happened upon a 1967 Time Magazine in a used bookstore recently, and was struck not by the bland coverage of the Vietnam War but by the ads. Yes, the ads. Why the ads? Because there were several for automobiles, a couple for airlines (back when that business was highly regulated and therefore highly profitable), and some for consumer goods such as air conditioners.  Like Sherlock Holmes' "the dog which didn't bark," the surprise is what wasn't being advertised:
drugs. Open any magazine in America today and you'll find most of the ads are for medications.
Exactly what does this profound shift say about our country? Just this:
Like Sherlock Holmes' "the dog which didn't bark," the surprise is what wasn't being advertised:
drugs. Open any magazine in America today and you'll find most of the ads are for medications.
Exactly what does this profound shift say about our country? Just this:
We are now Medication Nation. Half of all Americans take at least one prescription drug. Too fat and out of shape to have sex? We gotcha covered! All those fries and chips got your arteries clogged? We got your stents right here! High blood pressure from sitting on your duff watching TV for hours on end? Hey, take your pick! We've got a variety of pills for ya. Oh, they cost a wee thousand or two each--but your insurance company will cover it. No insurance? Well, that's a different story. We suddenly lost interest in your "health." (Actually, your health makes us no money. We hate your health! A pox upon your health! We love your illnesses! That's what makes us rich, rich, rich!) So now we as a nation glance at ads like this and don't even give them a second thought. Maybe we should. April 19, 2006 Five (Dangerously Misguided) Financial Fairy Tales The "Standard Model" of economists, pundits and analysts is: everything is coming up roses for the global economy. If you believe the heavyweights, the future's so bright, we all need shades: 
This glowingly positive model somehow fails to mention these more-than-minor risks: It's one thing to analyze these risks and and then conclude they're harmless, but to dismiss them without analysis seems more than a little shortsighted. The grave importance of these issues sparks me to cover them one at a time over the next week or so.  First up: oil. The whole model of unending growth for decades to come depends on one
little thing: cheap, plentiful oil. Yet experts tell us that all the super-large oil fields
in existence have already been found, and that the discovery of new oil reserves has been in
decline since the 60s.
First up: oil. The whole model of unending growth for decades to come depends on one
little thing: cheap, plentiful oil. Yet experts tell us that all the super-large oil fields
in existence have already been found, and that the discovery of new oil reserves has been in
decline since the 60s.
One of the few clearsighted pundits on this topic is Robert Kiyosaki, who penned a piece titled The Coming Oil CRisis. For a more in-depth view, read this excerpt from the Roscoe Bartlett Energy Conference and then wonder if the permanent 'global growth" bulls are on the same planet as the rest of us. (The conference is broken into three parts on the website; read all three for an excellent briefing on oil and alternative sources of energy.) This excerpt is long but well worth the investment of time, for it details the same "gap" that Kiyosaki foresees between the realization that there isn't enough oil and the construction of an alternative infrastructure: If this doesn't give you pause, exactly what will? April 18, 2006 Immigration Ironies  Take a look at this chart and tell me, do you see the irony at the heart of the
immigration debate? Why, do you reckon, are people risking their lives to cross the
U.S. border and make their way to Tennessee? For their health? Not likely; at least 516
Mexican migrants died attempting to get into the U.S., a 40% rise from 2004.
Take a look at this chart and tell me, do you see the irony at the heart of the
immigration debate? Why, do you reckon, are people risking their lives to cross the
U.S. border and make their way to Tennessee? For their health? Not likely; at least 516
Mexican migrants died attempting to get into the U.S., a 40% rise from 2004.
Do you reckon it's because there's jobs going begging in these states? That maybe someone in Tennessee willingly gave them a job? Well, who do you reckon gave them that job? Another illegal immigrant? The absurdities of this "debate" know no bounds, but let's cut directly to the heart of the matter: If there's no paying work, nobody risks their lives to get to Maryland, Tennessee, etc. How long is the line of "legal" Americans who are willing to take the kind of low-paying, arduous jobs being offered to the illegal immigrants? Nationally, unemployment is under 5%, so the number must be rather small. Maybe the truth is, there's nobody in that line. So if we erect a Berlin Wall across the U.S. border, and arrest everyone who risks their life to make it across, then who's going to do the work that these millions of workers are performing in Tennessee, Georgia, etc.? Laid-off auto workers? Go ahead and ask them if you want, but you're not going to get many takers for those janitorial, dishwashing and agricultural jobs. The irony is that building such a wall would undoubtedly cripple many American businesses. A second irony is that there is one sure way to stop illegal immigration: push the U.S. into a deep, prolonged recession. Once the work dries up, so will illegal immigration. The irony is that the huge demand for low-pay, low-skill labor reflects the enormous strength of the U.S. economy. Take away those workers, and you take away an essential element of the U.S. economy. Or, drain away the strength of the U.S. economy, and you lose those workers as millions of jobs disappear.  There's a deeper irony for all those demanding a new Berlin Wall. Go ahead and cut off
millions of young workers--but who's going to pay your Social Security in 20 years?
As this chart shows, the U.S. birthrate, though high by global standards, is barely at
replacement. As I have noted elsewhere
Boomers, Prepare to Fall on Your Swords
(also see the "Demographics" listings in the left sidebar),
the Social Security and Medicare systems' solvency rests entirely on future U.S. taxpayers.
As the ratio of worker to retiree drops from 10-to-1 down to 3-to-1,
the system simply cannot sustain itself. Once that ratio drops to 2-to-1, it collapses under
the weight of all those retirees.
There's a deeper irony for all those demanding a new Berlin Wall. Go ahead and cut off
millions of young workers--but who's going to pay your Social Security in 20 years?
As this chart shows, the U.S. birthrate, though high by global standards, is barely at
replacement. As I have noted elsewhere
Boomers, Prepare to Fall on Your Swords
(also see the "Demographics" listings in the left sidebar),
the Social Security and Medicare systems' solvency rests entirely on future U.S. taxpayers.
As the ratio of worker to retiree drops from 10-to-1 down to 3-to-1,
the system simply cannot sustain itself. Once that ratio drops to 2-to-1, it collapses under
the weight of all those retirees.
The solvency of Social Security and Medicare depends entirely on NOT building a Berlin Wall between a ready and hungry labor pool, and the millions of arduous, low-paying jobs which abound in the U.S. There is a long-term trend which I am familar with in my own family. My stepmother of 37 years proudly identifies herself as Mexican-American. She was born in Pasadena, Calif., and has lived there her entire life. She has worked all her life and recently retired. She has paid into the system, paying for all the retirees before her. Her father, disgusted by the racism he encountered in the U.S., returned to Mexico long ago. The point is that the children of immigrants, legal or otherwise, become American taxpayers. They support those of us already here, buy houses, pay their dues, and keep the nation economically vibrant and solvent. The quickest, surest way to cripple the U.S. economy for the long-term would be to build a Berlin Wall across the U.S. border. Only someone hoping to destroy the U.S. economy from within would promote such an idea. April 17, 2006 Happy Tax Day! Have You Checked Your Property Taxes Recently?  That complaint about income taxes may die in your throat when you consider the taxes paid by
our compatriots in Europe. Yes, 50% of Sweden's entire GDP is taxes. We know from our
Swedish and Danish friends that the average wage earner kicks in about 50-60% of their
income in taxes.
That complaint about income taxes may die in your throat when you consider the taxes paid by
our compatriots in Europe. Yes, 50% of Sweden's entire GDP is taxes. We know from our
Swedish and Danish friends that the average wage earner kicks in about 50-60% of their
income in taxes.
My brother (who's lived in France for many years) explains that while the total tax collected in each E.U. country is similar, each nation taxes different sectors of the economy at varying rates. Thus, businesses are heavily taxed in France, while workers pay a comparatively smaller percentage than their colleagues in, say, Germany, where workers pay more and companies pay less (again, in relation to France). Switzerland, he reports, has a low-tax structure similar to the U.S.--an observation supported by this graph. (Footnote: Japan's tax rate appears low, but this graph fails to note that Japan has been borrowing 40% of its government expenditures for many years. Their taxes, in other words, only pay for about half of the government services they receive. The rest is borrowed. The U.S. also borrows huge sums to pay for its government, which also distorts the actual "tax burden" picture.) But property taxes are another story. While income and other taxes may appear low in the U.S., the housing bubble is raising taxes at an astonishing rate (check Bubbling Property Taxes for more). Since the housing bubble really took off in 2003-2005, and many counties only reassess real estate parcels every five years or so, we can expect property taxes to continue climbing in many communities, even as the housing bubble deflates. For an example of another pathway to sharply higher property taxes, consider "voter-approved" tax increases. Here's how this works in California, where the basic property tax rate is fixed by Prop 13 at 1% of assessed value. The local county or city, forecasting a revenue shortfall, promptly closes the city libraries, lays off police officers, slashes music, shop, arts and sports programs in the schools (whatever's left after previous cuts) and cuts back on city park cleaning. (Somehow the City Hall bureaucracy magically remains intact throughout this brutal cost-cutting of popular services.) But wait--there is a way to get your library, police force, school programs and parks back. It's called a voter-mandated tax increase. With this "severe cutbacks in popular services" blade firmly stuck in our backs, voters approve the next round of tax increases. Want a paramedic in case Grandpa collapses on the sidewalk? Guess what--that'll cost you extra. Want some maintenance of local park trails? Nice--but we need a new tax. Wastewater upgrades? That'll cost you extra, too. Maintenance of school buildings, the local bus system--the list goes on and on. It makes you wonder where the sales, income taxes and property taxes we already pay go. Essentials like criminal justice, to be sure, but still--look at this list of voter-approved taxes which are currently part of a tax bill I happen to be extremely familar with: Bottom line: all this brings a nominally 1% property tax rate up to 2.25%. Though the increase in the appraised value of a property is also capped by Prop 13, this property's assessed value has risen by 25% in the past 13 years. 2% a year doesn't sound like much, but it adds up--especially when taxes are increasing by far more than advertised. (BTW this annual property tax bill clocks in at $4,886.) Do municipal services that citizens want cost money? Of course. But wouldn't it be better to justify a lump-sum higher tax rather than nickel and dime us with 24 additions to our tax bills? And then there's the fairness issue. Is it fair to all property owners that recent buyers are paying two, three or four times more parcel taxes than their neighbors? Clearly, it is not fair. But local government is letting the bubble buyers pay more rather than ruffle the feathers of all property owners by demanding a fairer tax structure. 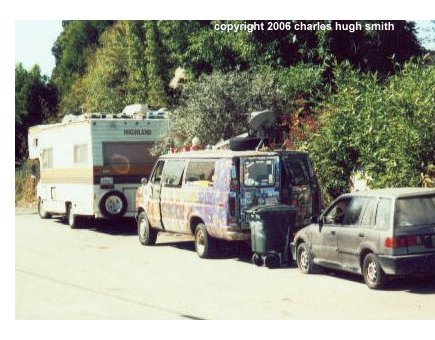 Bottom line two: a median-priced house in California costs $535,000; a median-priced home
in the Bay Area is about $700,000. The property tax bill on a $700,000 home in this town
comes to $15,575 annually. Gosh, even to my bubble-jaded eyes, that seems like a lot
of dough. Will that tax ever go down? Maybe... many years from now... after
a horrendous months-long battle with the assessor's office...if the maxed-out owner hasn't already bailed for
a nearby camper-trailer....
Bottom line two: a median-priced house in California costs $535,000; a median-priced home
in the Bay Area is about $700,000. The property tax bill on a $700,000 home in this town
comes to $15,575 annually. Gosh, even to my bubble-jaded eyes, that seems like a lot
of dough. Will that tax ever go down? Maybe... many years from now... after
a horrendous months-long battle with the assessor's office...if the maxed-out owner hasn't already bailed for
a nearby camper-trailer....
Are local governments truly starved for funds? It's hard to tell unless you're an expert. But clearly, property taxes have risen dramatically in much of the nation with very little fanfare. As the housing bubble pops (or deflates, fizzles, collapses, implodes, etc), we can be sure that the battle over property revenues/taxes will only heat up. We have a winner! Astute reader Jan G. recognized the Friday Quiz photo as being Travertine Hot Springs, just south of Bridgeport, California (on the eastern side of the Sierra Nevada). As the winner, Jan will receive a signed copy of my novel I-State Lines April 15, 2006 The Great San Francisco Earthquake 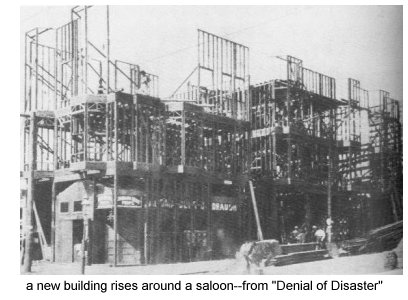 I was recently tasked to describe how the building code changed after the San
Francisco Earthquake of 1906. The results can be found in today's San Francisco Chronicle:
What San Francisco didn't learn from the '06 quake.
I was recently tasked to describe how the building code changed after the San
Francisco Earthquake of 1906. The results can be found in today's San Francisco Chronicle:
What San Francisco didn't learn from the '06 quake.
While this looks like a snoozer of a topic, you should read the piece if you live in the S.F. Bay Area. San Francisco, it turns out, is still very much at risk of conflagration in a major quake, and one reason is visible in the accompanying photo. Building codes didn't change much until the late 30s, and in the rush to rebuild the city as quickly as possible after the quake/fire, much of the construction repeated the same mistakes which had made the city so vulnerable to fire in 1906: wood frame buildings crammed cheek-by-jowl with no firewalls between them. A firewall is a fire-resistant material designed to slow the spread of fire between rooms or buildings; in modern codes, this is often a double thickness of Type X gypsum board (drywall, sheetrock, etc.). A row of wood houses pushed one against the other is akin to a large wooden warehouse: kindling awaiting a match, with virtually nothing to slow down a fire's advance. Sobering stuff, to be sure, and for a gripping account of the great quake/fire, truly astonishing photos--some of which are eerily reminiscent of Hiroshima after the atomic bombing--and more on fire hazards, check out a copy of Denial of Disaster: The Untold Story and Photographs of the San Francisco Earthquake and Fire or 1906 Another under-appreciated book on the earthquake hazards faced by all of California is A Dangerous Place: California's Unsettling Fate April 14, 2006 Friday Quiz: Where Is This? 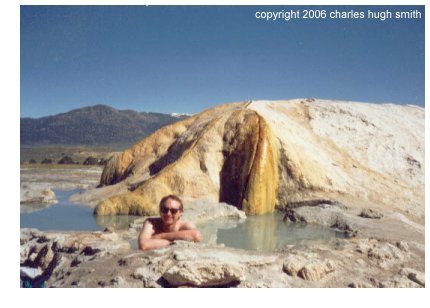 Since my novel I-State Lines (which
ships on April 24, should you be brave/ generous/ crazy enough to order a copy) is about two
young hapa guys traveling around the U.S. in a gloriously patched together Dodge Lancer,
the Friday Quiz will honor the wondrous American landscape for a month or two.
Since my novel I-State Lines (which
ships on April 24, should you be brave/ generous/ crazy enough to order a copy) is about two
young hapa guys traveling around the U.S. in a gloriously patched together Dodge Lancer,
the Friday Quiz will honor the wondrous American landscape for a month or two.
Though there is still so much of our amazing country I have yet to trod, I have been fortunate enough to car-camp through many astonishing American landscapes. I've drawn upon my own travels for these photos, and while they don't represent the full spectrum of American landscapes, they will hopefully inspire a bit of the wonders of the long American road To Somewhere New. Some of the places will be spots the two young fictional characters visit; others will have no relation to the book other than the exploration of America. Clearly, your truly is basking in the healing waters of a natural hot springs. But where? I'll ship a copy of my book to the first person who emails in the most accurate response. (Naming the state isn't close enough; it must be a town, the closest proximate town, or the name of the locale, should it have a name found on maps.) If the interest induced by this photo extends to my little book I-State Lines April 13, 2006 Bubbling Property Taxes As noted here and elsewhere, the housing bubble has naturally inflated property taxes across the nation. As this chart shows, the effect is just as strong in "Prop 13" California as it is in locales with no property tax limits. Astute reader Mark D., who lives in fast-growing San Benito County, south of Silicon Valley, responded to my entry on property taxes (Hidden Costs of the Housing Bubble) with this observation: I think you might underestimate the property tax increase in CA. With all the housing activity in CA, property taxes have increased in my county, San Benito from $16 million in 1990 to $37 million in 2000 and $57 million last year.Mark forwarded the statistics provided him by the San Benito County Treasurer, which show a mind-boggling jump of 54% from just five years ago: 2004-05: $57,690,904.The rise in San Benito is mirrored by similar leaps in other California communities. (According to the Bureau of Labor Statistics, inflation from 2000 to 2005 totaled 13%. Adjusted for inflation, property tax revenues in San Benito County rose by 41%. Don't you wish your income had risen, adjusted for inflation, by 41%?) This chart, topped by a wealthy suburb of San Francisco, supports Mark's contention rather well: 
* * * * * * * * * * * * * * * * * * * * * * * * * * * * * While those of us living in high property tax states like New York and California may wish we had the tax bills of those living in Texas and Georgia, the 30% to 50% leaps in property tax bills being handed out to shocked homeowners in such "non-bubble" locales shows the truly frightening scale and national reach of the housing bubble. (Inflation from 2000 to 2004 totaled 10%.) There are several causes behind the rapid rise in California property taxes. One, of course, is the building of new high-priced homes in once-rural, low-property value areas such as the Central Valley and the desert beyond Los Angeles (rather gloriously renamed The Inland Empire by PR-savvy locals some years ago). As the housing boom expanded the creep of sprawl into a sprint, "exurb" communities outside of L.A., San Francisco and Sacramento have seen rapid increases in residents and property taxes. Here's a list of the fastest growing cities in California. Notice that neither Danville nor Yorba Linda made the list, so their rising property values stem from something other than additional units of housing. One cause is clear: the "re-setting" of value when a property changes hands. When an existing home is sold, the assessed value of the property skyrockets to bubblicious heights--and of course, property taxes follow suit. As the number of homes being sold rises, so too does the county's assessed values.  Though there has been some building in Danville, CA over the past five years, it is a pricey
(and therefore growth-wary) suburb; the rise in property taxes comes not from hundreds of
new homes being added to the rolls but by the sales of homes for $1.2 million which had
been on the assessment rolls at $250,000.
Though there has been some building in Danville, CA over the past five years, it is a pricey
(and therefore growth-wary) suburb; the rise in property taxes comes not from hundreds of
new homes being added to the rolls but by the sales of homes for $1.2 million which had
been on the assessment rolls at $250,000.
The real mystery in the chart is what's keeping Colorado and Redmond, WA property taxes so stable, while most regions are experiencing shock-inducing rises. This chart of the Baltimore area's 40+% rise in taxes is more the norm; in my entry of April 6, Derailing the Property Tax Gravy Train, there are links and charts on hotspots of rising property taxes: Texas (represented by Plano in the chart above), Northern Virgina (represented by Alexandria) and Florida (represented by Kendall). The Baltimore graph reveals another interesting consequence of the bubble on local tax revenues: the astounding ascent of transfer taxes. As the bubble deflates and sales plummet, so will the income being derived from the transfers. All of this makes me wonder: what do local governments expect will replace all the vast revenue which will be lost as the bubble deflates? Losses not just in property taxes, but in lower sales tax receipts (all those cabinets, carpets and granite countertops which are no longer being sold) and income taxes (all those impoverished realtors, cabinet salespeople and drywallers with diminishing incomes). Do they hope to raise the taxes somewhere else? How? Who do they think will accept such a heavy burden just as the economy slides into deep recession? More on that another time. April 12, 2006 Oil Rising: $80, $94 a Barrel on the Horizon  While the precise cause of the next leap in oil prices is unknown, we can safely
predict oil will soon reach $80 a barrel--with predictably calamitous effects on the global
economy. Will it be Iran, Iraq, terrorism, Nigerian rebels, Venezuela, or a combination
of all of these? That is unknown. But what is known is the next stop in oil prices is $80
a barrel.
While the precise cause of the next leap in oil prices is unknown, we can safely
predict oil will soon reach $80 a barrel--with predictably calamitous effects on the global
economy. Will it be Iran, Iraq, terrorism, Nigerian rebels, Venezuela, or a combination
of all of these? That is unknown. But what is known is the next stop in oil prices is $80
a barrel.
First, let's review the fundamentals which are driving prices ever higher--supply cannot keep pace with demand, and there is virtually no production slack available to meet higher demand. For a cogent summary, let's turn to the Wall Street Journal of April 10: Oil Prices Show No Sign of Slowing; Tight Supplies, Capacity Spark Talk That Crude Could Reach $80 a Barrel. Is this number pulled from a hat? No--and here's why. Technical analysts have long been fascinated by the way the stock market's apprently random movements seem to settle on levels based on the so-called Fibonacci numbers, .38 and .62. These are ratios established by the Renaissance-era Italian mathematician Fibonacci. (.5 and 1 are also part of the series.) I've drawn lines on this chart to illustrate the uncanny tracking of oil prices to Fibonacci series numbers. First, we see that oil had settled at around $42 at the beginning of 2005. Such "settling" is called support and resistance in stock market lingo, as prices seem to resist going above (resistance) or much below (support) a level. If we calculate the two Fibo numbers from $42, we get price targets of $58 and $68. ($42 X .38 = $16, $16 + $42 = $58) ($42 X .62 = $26, $42 + $26 = $68) Voila, as if my magic oil rose to a support/resistance at $58, and then climbed up to the $68 level, where it sits today. Seeing how accurately the Fibo numbers have predicted the price of oil, let's extend the series into the future. Since oil settled into a new resistance/ support level at $58, we'll start a new series from there. ($58 X .38 = $22, $22 + $58 = $80) ($58 X .62 = $36, $58 + $36 = $94) Other analysts may prefer to work with the $42 level, which can be extended thusly: ($42 X 1.38 = $58, $58 + $42 = $100). After examining this chart, can you really doubt that oil will go to $80, or even $94? If so, why? Wishful thinking doesn't count. April 11, 2006 Complacency, Denial and Risk  Even as global stock markets hit multi-year highs, and bond markets bask in historically
low rates, the global economy rests precariously on three wobbly legs: oil, derivatives and
real estate. If any one of these crumbles, the global economy will crumble with it.
As these charts will reveal, the odds of all three crumbling are rising dramatically.
Even as global stock markets hit multi-year highs, and bond markets bask in historically
low rates, the global economy rests precariously on three wobbly legs: oil, derivatives and
real estate. If any one of these crumbles, the global economy will crumble with it.
As these charts will reveal, the odds of all three crumbling are rising dramatically.
As this chart illustrates, investors are supremely confident that the risks of financial conflagration are low. What this chart is saying is that investors are so sure bond yields will stay low 10, 20 and even 30 years out that they're demanding virtually no risk premium. This is another way of saying that no one expects inflation to be an issue, because if they did, they'd demand a higher yield on long-term bonds as "protection" against inflation eating away the value of their bond. Yet the long bond and short bond yields are virtually identical--the infamous "yield inversion" which is a harbinger of recession. Not everyone is so complacent, of course; check My Biggest Worry: The Bond Market: by analyst Gary Kaltbaum: There is no doubt the "market" has been acting just fine...but corrections start because of investor's conditioned sense that nothing can go wrong. We have news for them, corrections do occur.  The unprecedented rise of exotic financial derivatives adds a highly unpredictable and
volatile risk into the global mix. As the Wall Street Journal summarized:
History Says a Financial Calamity Follows Rate-Lifting Campaigns; So Far, So Good
The unprecedented rise of exotic financial derivatives adds a highly unpredictable and
volatile risk into the global mix. As the Wall Street Journal summarized:
History Says a Financial Calamity Follows Rate-Lifting Campaigns; So Far, So Good
Global investors threw a record $262 billion at private-equity funds last year, small-cap stock indexes are at all-time highs, and colleague Scott Patterson recently reported that more than $20 billion has flowed into emerging-market stock funds so far this year, matching the total inflow for 2005 and roughly five times the amount of money pumped into emerging-market funds in 2004, according to the research firm Emerging Portfolio Fund Research.That the wheels are coming off the housing market/bubble is beyond debate. For a report from the front lines-- Florida--read this: The dreaded "D" word surfaces from Mish's Global Economic Trend Analysis. Tomorrow: why we can safely predict $80 a barrel oil. April 10, 2006 Coming to a Market Near You in October: Crash! Though history doesn't repeat, it does tend to echo, for the simple reason that history and markets are both expressions of human emotions. Emotions, of course, form a limited palette, and so the primary ones--for instance, greed, euphoria, panic and fear--get recycled as circumstances develop which trigger these responses. 
* * * * * * * * * * * * * * * * * * * * * * * * Here are two charts worth pondering. The first is an overlay of the Great Stock Market Bubble of 1929 and the recent Great Tech Stock Nasdaq Bubble of 2000. This overlay reveals remarkable similarity of the two bubbles' pattern: a sharp rise and crash followed by a smaller "echo of the bubble" which lasts four to five years before the final exhaustion of greed. 
* * * * * * * * * * * * * * * * * * * * The second shows how the Dow Jones "echo-bubble" burst in 1937, about five years after the post-crash low of 1932. A cursory glance would suggest that the Nasdaq "echo-bubble" will finally run its course five years after its nadir in October 2002. But that would be discounting another stock market pattern with an extraordinarily regular history: the four-year presidential cycle. According to this pattern, stock market lows are typically struck in the even-numbered year between presidential elections. While the Dow obviously dodged this bullet in 1936--the final collapse occured a year later, in 1937--the cycle has been remarkably prescient since 1948. In the recent past, the markets hit their lows right on schedule in 1990, 1994, 1998 and 2002; the only real anomaly in the past two decades was the mini-crash which occured in 1987 rather than 1986. 
* * * * * * * * * * * * * * * * * The four-year cycle, a modern mainstay of market patterns, suggests that a major low will occur in October of this year. With the wheels falling off the housing market and financial risks being discounted to near-zero in the bond market, the stage is set for not just a minor drop but one which grabs euphoria and greed and transforms them abruptly into chilling fear and widespread panic. Welcome to the modern echo of 1937. April 8, 2006 Charting Unaffordability  Through painstaking research of 65 local U.S. real estate markets, I was able to chart
the affordability of housing in 1975 and 2005.
Through painstaking research of 65 local U.S. real estate markets, I was able to chart
the affordability of housing in 1975 and 2005.
Rather than bore you with dry statistics, I'll illustrate affordability with actual examples and numbers. Example 1: My father bought a house in a leafy area of Pasadena just a few blocks from Caltech and the Huntington Library for $74,000 in 1974. The equivalent might be the Hollywood Hills or Westwood in L.A., or an excellent neighborhood in Connecticut. Yes, it was a fixer-upper--a large, well-made original house from 1921 which hadn't been "remuddled." It even had a pool and a guest house. I was still in college, but working as an apprentice carpenter; had I been working full-time, I would have earned about $14,000 a year. My girlfriend could have easily made over half that if she'd been working full-time, so without vast skills a young couple could make a bit over $20,000 a year--meaning that a spacious, older fixer-upper (with a guest house, mind you) in a wonderful neighborhood was less than 4 times the income of a young couple just starting out. For my father, a mid-rank executive in a national retailer, it was less than two times income. If two starting salaries could swing the mortgage, then this was still amazingly affordable. Lesser houses in lesser areas were selling for $45,000 or so--only two times a dual income within reach of most workers. Example 2: A few years earlier, in 1971, my mother and stepfather bought a small but charming house perched on the hillside of Manoa Valley, one of the most desirable neighborhoods in what has always been one of the least affordable cities in the country--Honolulu--for $42,000. My stepfather had taken a pay cut from the public school system to work for a private high school, Punahou; he was making about $10,000 a year. My mother worked part-time at Liberty House, a department store. These were typical incomes; that $10,000 salary would be about $48,000 in today's dollars. (To confirm this, go to the Bureau of Labor Statistics website and select the "inflation calculator" from the upper-left heading "Inflation & Consumer Spending.") In other words, a couple with typical incomes could buy a small but pleasant home in a very desirable neighborhood in one of the nation's most expensive cities for about three times their annual income. Example 3: Fast-forward to 1997 and the California city of Albany, a quiet suburb of San Francisco located just north of Berkeley, a town which has long been desirable for its convenient location, walkable shopping district and highly-regarded schools. A couple of friends of ours were working part-time, making about $20,000 each, and they bought a small fixer-upper in Albany for $145,000, less than four times their two part-time salaries (or one unremarkable salary). You did not need a high income to buy a desirable house; you needed only moderate incomes--even two part-time jobs would do the trick. Some other friends bought a perfectly sound, non-fixer house nearby for about $165,000--again, roughly four times a very average wage for one person, or two moderate incomes ($20,000 a year per worker). Now this is for homes in a coveted suburban town in one of the most expensive and desirable areas of the country--the San Francisco Bay Area, a mere 8 years ago. It's important to note here that wages, as has been widely reported, have not even kept up with inflation; as reported in the Wall Street Journal, Wages Fail to Keep Pace With Productivity Increases, Aggravating Income Inequality: Since the end of 2000, gross domestic product per person in the U.S. has expanded 8.4%, adjusted for inflation, but the average weekly wage has edged down 0.3%.In other words, the rise in housing has occured not because of strong wage growth but despite no wage growth. Many people make less than they did in 2000 due to downsizing, and many more have received little or no wage increases in that time, actually falling behind inflation. No doubt you have similar recollections of similar prices and houses in similar locales. So let's look at today. That $20,000 a young couple could make in 1975? About $73,000 in today's dollars. (Interestingly, the BLS reports the average wage in the U.S. is $16.50 per hour, or an annual income of $34,000. Two workers would thus earn about $70,000--confirming that the $73K number is still an average or typical wage for a couple.) The houses in that Pasadena neighborhood? Try $850,000 and up, or 12 times the young couple's income. And the houses in Manoa? Surprise, $850,000 and up. How about a little house in Albany, CA? Our friends cashed out for $550,000 almost two years ago, so figure $600,000, or 15 times their combined salaries. The lack of affordability gets laid on environmental restrictions, but this simply doesn't align with the reality that the same supposedly impossible restrictions were in place 20 years ago--yet houses in the Bay Area were still affordable to typical working stiffs as recently as 8 years ago. Perhaps the real cause is "bubbling" up all around us. April 7, 2006 Friday Quiz: Why Should Anyone Order My New Book? 
I-State Lines? Answer 1: Because the writer is a poor, dumb unknown with no other prospects other than fellow weblog readers and his loyal friends. Answer 2: Because the book on the buyer's shelf will be a happy reminder of the always-pleasing thought, "I could do better than that with one hand tied behind my back!" Answer 3: Because the reader need only sacrifice a forgettable first-run movie at a theater, a small Coke and a medium popcorn to buy the discounted book on Amazon ($13). Unlike the movie, however, the book is perfect for balancing that wobbly table in your den, and will serve that function very attractively and reliably for years. Answer 4: Because the book is the ideal gift for that "impossible-to-buy-gifts-for" age group of 18-25, since it's about youth tackling adulthood head-on: moral awakening, idealism, sacrifice, falling in love, friendship, cars breaking down, first jobs, traveling and being gloriously, desperately broke. Oh, and it's a comic novel. Answer 5: Because you'll earn the public and private gratitude of a poor dumb unknown who, unlike all those rich and famous authors you enjoy reading, is supremely grateful for readers. Answer 6: Because the book is episodic, you can open it anywhere and start reading-- perfect for a commute or "throne-side" amusement. Answer 7: Because the publishers who are taking a chance on it are real people, Martin and Judith Shepard, not some German corporation (which owns numerous American imprints that masquerade as "independent publishers"), who've been publishing books (though they must have doubts about this one) for 30 years. Order the book from The Permanent Press, a real independent publisher, (or if you want the discount, from Amazon.com Note: the Amazon pre-order price does not yet reflect the soft-bound list price of $20, which will be discounted to about $13. If you order something else to bring the value up to $25 (another book, a DVD, a CD, towels, etc.), then shipping is free. Here are some other books/films to consider for your order. April 6, 2006 Post-Bubble Blues: Derailing the Property Tax Gravy Train  Following that most venerable political cliche--"Social Security is the
third rail of American politics, touch it and you die"--a railway metaphor aptly describes
the effect of the housing bubble bursting on local government revenues: derailment.
Following that most venerable political cliche--"Social Security is the
third rail of American politics, touch it and you die"--a railway metaphor aptly describes
the effect of the housing bubble bursting on local government revenues: derailment.
First up is a graph charting the breathtaking ascent of property values in bubblicious locales. Though this chart illustrates Florida real estate's heady climb, all bubble-driven areas share the same characteristics: a rapid rise on property values from the late 90s to the present.  Unsurprisingly, property taxes have tagged along for the ride--at least in those states
which lack a "Prop 13"-type cap on property tax increases. This second chart reflects
the 2005 revenue and spending of a large Northern Virginia suburb of Washington, D.C.,
one of the frothiest markets outside of California.
Unsurprisingly, property taxes have tagged along for the ride--at least in those states
which lack a "Prop 13"-type cap on property tax increases. This second chart reflects
the 2005 revenue and spending of a large Northern Virginia suburb of Washington, D.C.,
one of the frothiest markets outside of California.
Also unsurprisingly, homeowners are starting to rebel against the sudden leaps in their property tax bills (for example, see this Wall Street Journal story, Texas-Sized Tax Revolt), as local governments are collecting taxes and spending like no tomorrow. Notice how property tax revenue jumped an astounding 14.6% in a single year, enabling the local government to increase spending by 8.7%--more than double the expansion of the U.S. economy (the GDP grew around 3% per year for the past few years). If this doesn't define "impending fiscal train wreck," I don't know what does.  Next up we have a chart illustrating the remarkable rise in building permit valuations in
a fast-growing Northern California exurb (Tracy). Though Prop 13 caps the increase in
assessed value of existing properties, it doesn't cap the value of new homes. This chart
reveals the pernicious effect of the housing bubble even in Prop 13-protected locales. Recent
buyers are stuck with sky-high valuations which will never recede until they petition for
a lower assessed value in the post-bubble decline.
Next up we have a chart illustrating the remarkable rise in building permit valuations in
a fast-growing Northern California exurb (Tracy). Though Prop 13 caps the increase in
assessed value of existing properties, it doesn't cap the value of new homes. This chart
reveals the pernicious effect of the housing bubble even in Prop 13-protected locales. Recent
buyers are stuck with sky-high valuations which will never recede until they petition for
a lower assessed value in the post-bubble decline.
Note how modest the previous real estate bubble in the late 80s looks compared to the present monster bubble. This chart shows just how outsized the current bubble is compared to historic norms. As astute reader/fellow blogger Marinite suggested, I should note here that inflation accounts for 52% of the rise from 1990 to the present. That is, a dollar in 1990 is now worth $1.52. A $100,000 house in 1990 would thus be worth $150,000 in today's money if housing rose only with inflation, and a $100,000,000 worth of building permits would, if housing activity stayed constant, clock in at $150,000,000 today. It's easy to see that the rise in property values and building permit valuations far exceed the 52% increase caused by inflation. Even with Prop 13 caps in place, note that Tracy's capital improvement projects budget has climbed sharply in the past few years. Some of this is demand-driven, as fast-growing suburbs must build schools, roadways, parks and other improvements to serve the new subdivisions. But what happens when the revenue growth spigot is turned off? According to the Wall Street Journal story: Across the country, the hottest money issue at the state and local level is property taxes. Tax collectors are reaping giant windfalls from the national housing boom, as the average property tax on an American home has climbed to just shy of $3,000 a year. The National Taxpayers Union reports that Texas is one of at least 20 states -- including Arizona, Idaho, New Hampshire, Nevada and South Carolina -- where homeowners are rebelling against soaring assessments that in some cases are taxing people out of their homes. Texas is the epicenter of this backlash, because property tax bills in some localities have doubled in seven years.(Now if only the other states would donate this $25 billion to California, we could clear up our deficits from the past few years!) Given the magnitude of the bubble, the decline in property values will reach similarly epic proportions. What other sources of revenue will state and local governments tap in order to maintain revenues at current levels? Maybe there aren't any. As housing takes the economy down into recession, other revenue sources such as sales taxes and income taxes will also suffer declines. State and local governments will have no choice but to shrink, and shrink as rapidly as their revenues. By willingly hitching their train to the overheated housing bubble engine, state and local governments have unwittingly guaranteed that they will not only share the pain of their constituents, but will actively increase their misery by slashing services and capital improvement budgets. April 5, 2006 Future Affordability: The Mobile Homeless
This may well be the future of post-bubble affordability. This is a photo of what I
call wheeled vagabonds
but others call the mobile homeless. I wrote an entry last August on the phenomenon, and
noted that it's been an alternative housing choice for many years, if not decades, for those
on tight budgets or the temporarily jobless/down on their luck.
 As a self-supporting (i.e. impoverished) university student back in the early 70s, I'd
briefly considered
modifying a rusting delivery van into a mobile, if cramped, living space. I even had a few
streets deep in Manoa valley marked out as safe parking places.
I'd also looked into living on a small boat in the Ala Wai Yacht Harbor as an alternative to
the extraordinarily burdensome rents in Honolulu, then as now, one of the most expensive
cities in the nation. (The highest has always been either Anchorage, Alaska or Honolulu, Hawaii.)
As a self-supporting (i.e. impoverished) university student back in the early 70s, I'd
briefly considered
modifying a rusting delivery van into a mobile, if cramped, living space. I even had a few
streets deep in Manoa valley marked out as safe parking places.
I'd also looked into living on a small boat in the Ala Wai Yacht Harbor as an alternative to
the extraordinarily burdensome rents in Honolulu, then as now, one of the most expensive
cities in the nation. (The highest has always been either Anchorage, Alaska or Honolulu, Hawaii.)
Alas, the cost of a boat slip was almost as much as the rent on my hovel/studio (literally the cheapest rent in Honolulu at $125/month, about $560 in today's money). Since I didn't have the savings or borrowing power to buy a large vehicle or a boat, It was actually more practical to pay the rent, even though it was about half of my monthly part-time paycheck. The lack of a bathroom, however, pretty much kills the deal--unless you have no choice. And it seems that plenty of people already have no choice. Keeping It Secret as the Family Car Becomes a Home (New York Times) Mobile Homeless Family in San Francisco (San Francisco Chronicle) Mobile Homeless Woman in San Francisco (San Francisco Chronicle) Mobile Bus Shelters in Honolulu (Honolulu Advertiser)  If you read these stories, you'll find that the mobile homeless are not
the hard-core, drug-addled homeless found on the streets of urban America, but people
who lost their homes via job loss, divorce and other forms of personal trouble.
If you read these stories, you'll find that the mobile homeless are not
the hard-core, drug-addled homeless found on the streets of urban America, but people
who lost their homes via job loss, divorce and other forms of personal trouble.
Some are employed, the so-called working poor; most of the unemployed find a job within a matter of months. So what happens to our economy when the housing bubble bursts? What always happens in a recession--job losses and tighter lending, which then lead to foreclosures and the loss of savings, homes and equity. That the bursting of the housing bubble will take down the entire economy is undeniable; please refer to A Coup de Grace to the Economy and A Monster of a Housing Bubble for the charts which outline the path of doom: as housing starts dropping in value, Americans are unable to borrow the hundreds of billions in home equity which has sustained the U.S. economy for years. (The national savings rate, by the way, is -.5%. Yes, we've spent more than we've made for many months now.) The contracting housing market causes lenders, carpenters, carpet salespeople and all the other hundreds of thousands of people whose livelihoods depended solely or largely on a booming housing market to either lose their jobs or suffer grievous losses of income. As the economy contracts, people beyond housing start to get laid off. Mortgage rates rise as the U.S. recession causes foreign investors to curtail their purchases of U.S. Treasury bonds, bumping interest rates up even as demand for housing plummets. All the calamities reinforce each other in a negative feedback loop which I (and many others) have described elsewhere (see sidebar stories under "Financial Meltdown Watch" and "Housing Bubble Watch.") This table and chart of plummeting affordability presages an enormous number of mortgage defaults and loss of equity as the housing bubble pops. The numbers indicate that vast numbers of citizens, most prominently on the West and East Coasts, have stretched their family incomes to terribly risky limits in order to buy a house, gambling, in effect, on a continued rise in appreciation. You might call this "strip-asset poker," because losing that bet will strip them of all their assets save their car and clothing. A national tragedy will soon unfold before our horrified eyes, and cities would do well to begin setting aside properly maintained areas for the mobile homeless, whose numbers are sure to increase. Sadly, these will not just be college kids, but families who bet it all on the American Dream of homeownership in a bubble economy. April 4, 2006 Another Chart for Predicting the Bottom in Housing  Yesterday we looked at trendlines as a way of predicting post-bubble housing prices.
Here's another method. As you can see in this chart, once adjusted for inflation,
housing prices tend to act much like stock prices--an initial rise reverts to the
starting point before pushing to a new high, which then recedes to a new support level.
Yesterday we looked at trendlines as a way of predicting post-bubble housing prices.
Here's another method. As you can see in this chart, once adjusted for inflation,
housing prices tend to act much like stock prices--an initial rise reverts to the
starting point before pushing to a new high, which then recedes to a new support level.
Since housing established a new base in the early 90s, it would seem plausible that post-bubble, it would return to a level between $160,000 and $180,000 before starting another leg up. This chart supports the view that housing appreciates (adjusted for inflation) about $20,000 each decade. This would suggest that the price of a new home will drop from the recent median peak price of $244,000 back down to around $180,000. Yesterday's calculations suggested a 30% decline in overall housing prices was plausible; a 30% decline from $244,000 would indicate a post-bubble new-home price of about $170,000. If history echoes (rather than repeats), and housing appreciates $20,000 in the decade 1990 - 2000, then this bubble will likely revert to the $180,000 level. Based on this chart, we can conclude that if history is any guide at all, the price of a new home will decline from its bubble peak of $244,000 down to about $170- $180,000. Anyone interested in bubbles (in tulips, real estate, commodities, stocks, you name it) will benefit from reading Irrational Exuberance April 3, 2006 As the Housing Bubble Pops: Where's the Bottom?  As this chart of the NASDAQ from 1990 to the present illustrates, bubbles tend to
deflate to the underlying trendline. If you consider the trendline, it's as if the
bubble never happened. A similar trendline can be drawn on the charts of all great bubbles:
the Dow 1929, the Nikkei 1989, and so on. Since prices always revert back to the
trend, this line makes a reasonably accurate forecasting or predictive tool.
Which brings us to the current real estate bubble. First, let's take a closer look at the classic
NASDAQ bubble shown above. The actual hockey-stick rise which characterized the bubble only
lasted about 18 months--from the LTCM meltdown and Russian default in September 1998 to March of 2000.
A year later, the market had already reverted to the trend line. If you
remove that 2.5-year period of sharp rise and decline, the only serious violation of the trend
was the post-bubble drop to 1100 in late 2002. As such over-reactions are another standard
feature of bubbles, such a decline fits the historic profile. Other than this, the market has
followed the trendline with remarkable fidelity.
As this chart of the NASDAQ from 1990 to the present illustrates, bubbles tend to
deflate to the underlying trendline. If you consider the trendline, it's as if the
bubble never happened. A similar trendline can be drawn on the charts of all great bubbles:
the Dow 1929, the Nikkei 1989, and so on. Since prices always revert back to the
trend, this line makes a reasonably accurate forecasting or predictive tool.
Which brings us to the current real estate bubble. First, let's take a closer look at the classic
NASDAQ bubble shown above. The actual hockey-stick rise which characterized the bubble only
lasted about 18 months--from the LTCM meltdown and Russian default in September 1998 to March of 2000.
A year later, the market had already reverted to the trend line. If you
remove that 2.5-year period of sharp rise and decline, the only serious violation of the trend
was the post-bubble drop to 1100 in late 2002. As such over-reactions are another standard
feature of bubbles, such a decline fits the historic profile. Other than this, the market has
followed the trendline with remarkable fidelity.
 So what's the trendline in the housing market, and where
does it suggest prices will finally settle? Note that much of the housing
bubble has occurred in an eerily similar period of time--less than two years--from early 2004 to late 2005.
This is the period in which housing exploded 40-50% higher in markets such as Phoenix,
Florida and Las Vegas, and 30% or more in many California cities. This sudden sharp
leap is precisely the pattern of a bubble.
So what's the trendline in the housing market, and where
does it suggest prices will finally settle? Note that much of the housing
bubble has occurred in an eerily similar period of time--less than two years--from early 2004 to late 2005.
This is the period in which housing exploded 40-50% higher in markets such as Phoenix,
Florida and Las Vegas, and 30% or more in many California cities. This sudden sharp
leap is precisely the pattern of a bubble.
If the housing bubble follows the historic pattern of other bubbles--and there is no reason to suspect it will deflate any differently than other bubbles--we can forecast a rapid decline to the underlying trendline. And what is that trendline? If we draw a simple line from 1970 to the present through the median home price in the U.S. (not adjusted for inflation), we see that the 25-year period from 1970 to 1995 follows a very regular trendline, despite the soaring inflation of the early 1980s. We can see that the appreciation of housing was already above the trendline in 2000, reflecting the general euphoria and asset-appreciation of the go-go late 90s. But the real violation of the trendline has occurred since 2000. The trendline suggests that the median price of a house will fall from $214,000 to about $145,000 in the next few years--a 32% decline. There is other evidence to support this valuation target. If you consult the inflation calculator on the Bureau of Labor Statistics page, you'll find that inflation has risen from 1990 to 2006 by 52%. That is, $1 in 1990 is worth $1.52 in today's currency. (Never mind inflation has been understated for years--that's another story I've covered elsewhere.) That means the median house price of $95,500 in 1990 would equal $145,160 in today's money--remarkably close to the trendline prediction of $145,000. Since inflation has driven the value of $1 in 1970 to over $5, the $23,000 median price house in 1970 would be worth over $120,000 now just from the effects of inflation. It could be argued with legimate references to past bubbles that a post-bubble over-reaction could take the median house price back to this $120,000 level, just as the NASDAQ fell sharply below the trendline in the initial post-bubble deflation. Since the median price of a house in California is $535,000, we can extrapolate a 32% decline to $365,000 as a post-bubble target. This isn't what the real estate industry wants to hear, but the charts are rather persuasive. April 1, 2006 Kroika Makes Bid for Oreo--Nation in Uproar  Kroika Cookie and Biscuit Company, Ltd., shocked the snack world today by making an
unsolicited offer of $26 billion for American icon Nabisco, home of the Oreo cookie.
The surprise bid from obscure Kroika sent shockwaves rippling all the way to Washington
as the bid was quickly matched by a Dubai-based firm seeking to expand beyond oil.
Kroika Cookie and Biscuit Company, Ltd., shocked the snack world today by making an
unsolicited offer of $26 billion for American icon Nabisco, home of the Oreo cookie.
The surprise bid from obscure Kroika sent shockwaves rippling all the way to Washington
as the bid was quickly matched by a Dubai-based firm seeking to expand beyond oil.
As readers know, I have a fat consulting contract with Kroika to assist their marketing and branding here in the U.S. Readers may also remember that the majority owner of Kroika is the People's Liberation Army (PLA), while the minority owner is a shadowy Dutch multinational with roots stretching back to the 17th exploitation of Sumatra--specifically, bat guano and the once-plentiful and now rare Sumatran Boatplug hardwood.  One senator was heard to snort, "I'll be gol-durned if the dang Chinese Army and some
Dutch thieves are gonna own Oreos!" Meanwhile, the LBO (leveraged buyout) specialists
who own RJR-Nabisco (and thus the Oreo brand), KKR, were reportedly "interested in seeing
who sweetens the bid" upward. KKR borrowed $26 billion to buy both Nabisco, the home of
heartwarming American brands, and the tobacco giant, RJR, forming a marriage obviously made in
Heaven. Breaking up the pair is a devastating possibility, de-linking cigarets and Oreos.
One senator was heard to snort, "I'll be gol-durned if the dang Chinese Army and some
Dutch thieves are gonna own Oreos!" Meanwhile, the LBO (leveraged buyout) specialists
who own RJR-Nabisco (and thus the Oreo brand), KKR, were reportedly "interested in seeing
who sweetens the bid" upward. KKR borrowed $26 billion to buy both Nabisco, the home of
heartwarming American brands, and the tobacco giant, RJR, forming a marriage obviously made in
Heaven. Breaking up the pair is a devastating possibility, de-linking cigarets and Oreos.
Rumors are swirling that KKR is negotiating a side deal with the PLA--the PLA gets Nabisco only if the Chinese Army buys RJR cigarets for all its troops. One staunchly protectionist senator--off the record, of course--said he was open to the idea. "If we can kill off the Chinese Army with cigarets, then losing Nabisco might make strategic sense." The Dubai firm, meanwhile, was promising to keep all manufacturing in the U.S., allaying fears of yet more job losses in U.S. manufacturing. KKR is keeping its cards close to its vest, but inside spies report the prevailing view is strictly self-interested greed: "It's ours to sell to the highest bidder. Any interference by the government is pure Socialist meddling." In unrelated news, KKR welcomed the government's limitations on tobacco-related liability lawsuits. Happy April Fools Day! Welcome, readers, welcome. Please browse this month's entries and the archived wEssays listed in the sidebar. If nothing here strikes your fancy, skim through my recently published articles (generally in the San Francisco Chronicle) and my archives back to 1995. I would be honored if you link any essay to your website, print a copy for your own use or add my RSS or Atom feed. And of course I appreciate your recommendations of this weblog and your comments: csmith@oftwominds.com. wEssay noun, combination of 'web' and 'essay,' denoting a short online essay which exploits the hyperlinks, interfaces and interactive capabilities of the World Wide Web; coined by Charles Hugh Smith on May 1, 2005, in Berkeley California. copyright © 2006 Charles Hugh Smith. All rights reserved in all media. |
Subscribe via RSS: search my site:
Worth Reading:
Mish's Global Economic Trend Analysis patrick.net Marin Real Estate Bubble ilind.net PACT America Gold Eagle myrealestatebubble.com (links to articles and eBook) |
||
|
Our retail policy: Nothing is for sale except books/films I recommend and my own novel I-State Lines (via links to Amazon.com) Free alternative: find them at your local library |
home |
 Weblog and wEssays
 Now this is an extraordinarily important report that, even though I didn't help author this
report, I want to hammer on it for a few minutes because I think it's something that everyone
should be talking about and virtually no one is. It was commissioned by the U.S. Department
of Energy, paid for by the U.S. Department of Energy. Science Applications International
Corporation compiled the report. Robert L. Hirsch was the project leader, and the title
of it is "Peaking of World Oil Production Impacts Mitigation and Risk Management."
Now this is an extraordinarily important report that, even though I didn't help author this
report, I want to hammer on it for a few minutes because I think it's something that everyone
should be talking about and virtually no one is. It was commissioned by the U.S. Department
of Energy, paid for by the U.S. Department of Energy. Science Applications International
Corporation compiled the report. Robert L. Hirsch was the project leader, and the title
of it is "Peaking of World Oil Production Impacts Mitigation and Risk Management."
 But the biggest victim of rising rates might be less exotic, and closer to home --
literally -- and we may be seeing the early stages of its decline. The average rate on a
30-year fixed mortgage rose last week to the highest since September 2003, and sales of
new and preowned homes have been on the decline for months in the U.S., with the inventory
of unsold homes rising.
But the biggest victim of rising rates might be less exotic, and closer to home --
literally -- and we may be seeing the early stages of its decline. The average rate on a
30-year fixed mortgage rose last week to the highest since September 2003, and sales of
new and preowned homes have been on the decline for months in the U.S., with the inventory
of unsold homes rising.


![[Valid RSS]](valid-rss.png "Validate my RSS feed")
![[Valid Atom 1.0]](valid-atom.png "Validate my Atom 1.0 feed")