What Happens to Sales and Employment When Corporate Profits Fall?
April 7, 2015
Corporate profits are back at the levels reached in 1990, 1999 and 2008 that presaged recessions and a sharp downturn in sales and employment.
It really isn't a surprise that corporate profits are falling: not only is the stronger U.S. dollar (USD) crushing the overseas profits of U.S. global corporations when reported in USD, but both the U.S. and global economies are slowing.
Since corporations have slashed every possible cost to the bone in the past six years, slowing economies lead to lower sales which lead to declining profits.
Head-count has been slashed, suppliers have been squeezed, high-interest loans have been refinanced, under-performing stores have been shuttered, high-cost properties have been sold--there really isn't much left for Corporate America to slash and burn to skim more profit.
So what happens to sales and employment when corporate profits start sliding? Longtime correspondent B.C. kindly shared a number of charts to answer this question, and I've selected two to discuss.
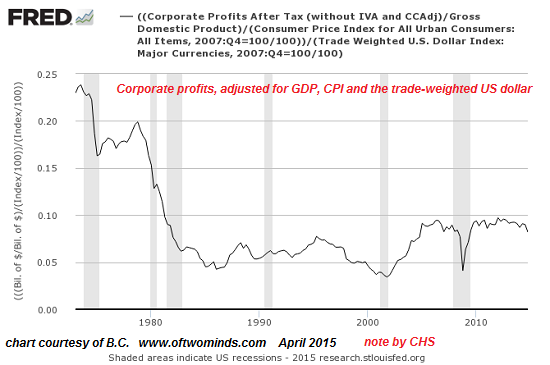
The first is corporate profits, adjusted for GDP, the Consumer Price Index (CPI) and the trade-weighted U.S. dollar. The problem with nominal profits, or indeed any financial data point, is that they can only be analyzed in the context of the factors that affect their purchasing power in the real world.
For example, nominal corporate profits might rise by 10% a year, a number that looks very positive in isolation. But if inflation is running at 15%, then those profits are actually lagging the general decline in purchasing power.
Profits earned in currencies that are weakening are another example of nominal numbers not telling the real story.
This is why I often post charts of financial data priced in oil or gold--real-world commodities that cannot be gamed like unemployment, profits and a host of other data that is deemed important.
This is the value of B.C.'s chart: this is corporate profits adjusted for the critical economic contexts of GDP, CPI and the trade-weighted USD.
Profits have rolled over, after topping out at 2007 levels:
The second chart displays corporate profits, real final sales and employment. In this chart, corporate profits are adjusted for real GDP (i.e. adjusted for inflation). Note that profits lead sales and employment: when profits drop, sales and employment typically follow. This chart tracks year-over-year (YoY) changes:
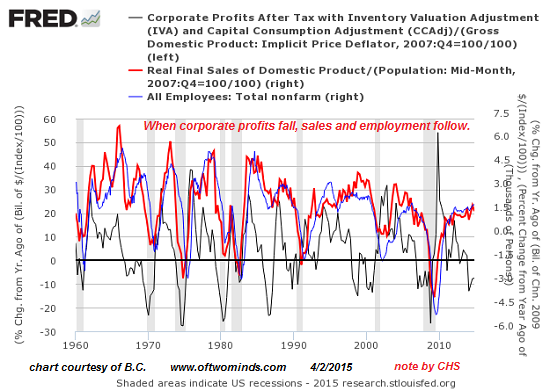
Corporate profits are back at the levels reached in 1990, 1999 and 2008 that presaged recessions and a sharp downturn in sales and employment. Profits adjusted for real GDP are noisy, but the recent drop in profits is clear.
If recent history is a reliable guide (and why wouldn't it be?), sales and employment have both topped and are about to fall sharply. At this point, it's wise to recall what the Federal Reserve cannot do:
1. It cannot force employers to hire more employees or pay them more.
2. It cannot force households or enterprises to borrow more money.
3. It cannot force households or enterprises to spend disposable income on non-essentials.
I suspect many households are like ours--tightening their belts and spending as little as possible in order to pay higher property taxes and federal and state income taxes.
Given the risks of a slowing economy, it's crazy to hire more employees or borrow more money unless the return on those investments is immediate, immensely profitable and recession-proof. Few investments meet those criteria.
NOTE: Contributions/subscriptions are acknowledged in the order received. Your name and email remain confidential and will not be given to any other individual, company or agency.
|
Thank you, James Y. ($5/month), for your superbly generous contribution to this site-- I am greatly honored by your steadfast support and readership. |