
|
|
| weblog/wEssays archives | home | |
|
A Power Not To Be Denied: Santa Claus (November 19, 2007) There are some forces in the galaxy you don't want to challenge, and one of them is Santa Claus, as in "Santa Claus Rally." It is a ripe old Wall Street cliche that come November and December, the market rallies just as surely as children gather round the Christmas tree (or equivalent). To illustrate the possibility that this cliche has some merit, at least recently, I prepared this chart: 
Well gosh darn it, at least in the past few years, Santa Claus has come very reliably to Wall Street. This seems to be true even in low-volatility years bound in long-term trading ranges. Even though MACD is trending down right now, we note that MACD was also trending down in 2004--yet Santa Claus delivered a rally anyway. Supporting Saint Nick's possible delivery of a powerful uptrend through the first week of January is the fact that the DJIA has just bounced off the Bollinger bands and the long-term 50-day moving averages. One highly astute reader has repeatedly called my attention to the fact that fund and institutional investors have a strong incentive to juice the market at the end of every quarter so their performance is improved by quarter's end. And how much more important for one's calendar year performance to rise up by December 31. Another explanation given for Santa's largesse into January is the massive flood of 401K and IRA retirement money flowing into mutual funds' waiting hands--some of which is often promptly put to work goosing the market higher. Is this advice? No, just hearsay and personal opinion. Santa could always deliver a load of coal to Wall Street which, in a year of astoundingly insane risks gone bad and stuffed under the bulging carpet, richly deserves it. Nonetheless, the Santa Claus Rally is a multi-year trend with a significant pedigree. Since I wrote about "returning to averages" on Friday, frequent contributor Harun I. was kind enough to forward several charts of the Dow Jones Industrial Average from 1900 to the present which illustrate the point I was trying to make much better than my graph by displaying Standard Error Channel trendlines over actual price data. Here are Harun's comments about Standard Error Channels: I am sure that you understand the concept of regression analysis. The Standard Error Channel has at its core a linear regression line.Since I wasn't sure I understood, I went to this Wikipedia entry for help: regression analysis. Here is Harun's first chart and his commentary: 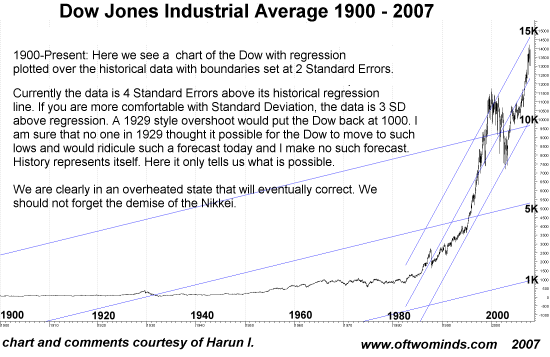
Just to return to the top of the channel, or the lower line of the recent channel, the DJIA would need to decline to 10,000. A move to the regression line would require a move down to 5,000, and a test of the lower channel would take it, as Harun noted, to about 1,000. If this strikes you as impossible, recall that no one predicted the Nasdaq would fall from 5,000 to 1,100 in less than three years, or that in 1929 (as Harun observed) that the DJIA was about to start a slide which would eventually erase 90% of its value. In the second chart, the red channel is drawn from the 1932 low to the present highs, and the blue channel is drawn from 1900 to the 2002 market low. 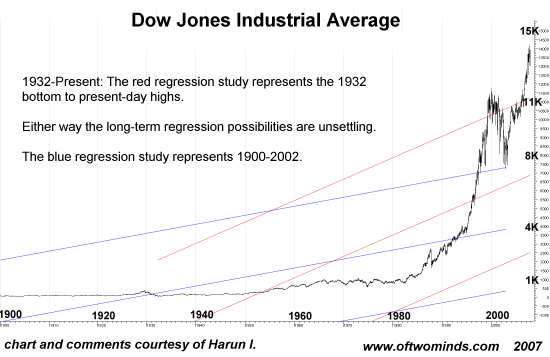
Even with this revised channel, the DJIA would have to decline to 11,000 to reach the top channel, 7,000 to drop back to the regression line and 2,500 to the lower channel. Whatever channel you draw, it's clear the U.S. stock market has risen far above long-term regression channels. As someone who thinks in terms of standard deviations, a standard deviation of 3 suggests a very high probability of a reversion to the mean, another way of saying probabilities favor a huge decline. Does any of this negate a Santa Claus rally? Not at all, for a Santa Claus rally occurs over the course of a few weeks, while the long-term trends occur over the course of years and even decades. Recall that the DJIA has equaled an ounce of gold at Bear Market bottoms such as 1982 (i.e. 800 on the DJIA and $800/ounce for gold). Could gold rise to $2,500/ounce and the DJIA decline to 2,500? Perhaps the question should be: why not? Thank you, Don E., ($10), for your on-going and very generous contribution to this humble site. I am greatly honored by your readership and commentaries. All contributors are listed below in acknowledgement of my gratitude. For more on this subject and a wide array of other topics, please visit my weblog. copyright © 2007 Charles Hugh Smith. All rights reserved in all media. I would be honored if you linked this wEssay to your site, or printed a copy for your own use. |
||
| weblog/wEssays | home |