The U.S. Economy Slows to Stall Speed
April 2, 2015
This long-term weakening of the economy is the direct result of financialization and the Federal Reserve's policy of propping up impaired debt with more debt and constantly bringing demand forward with zero interest rates.
The U.S. economy is slowing to stall speed--the point when gravity overcomes the lift provided by central bank free money. This deceleration is evident in a number of indicators such as gross domestic product (GDP), which is now at 0% according to the Federal Reserve Bank of Atlanta's GDPNow model.
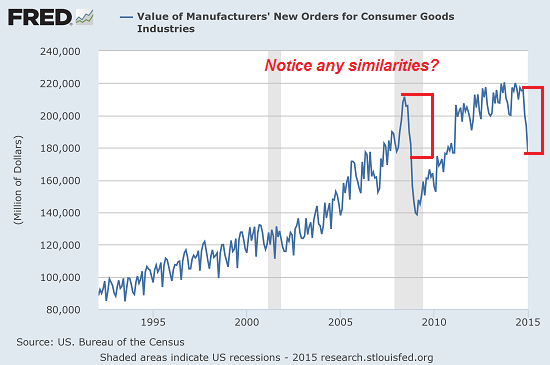
New orders for consumer goods has fallen off a cliff, eerily repeating the freefall of the Great Recession in 2008:
Longtime correspondent B.C. shared two more insightful charts of the economy's deceleration to stall speed. Rather than depict one or two indicators, B.C.'s charts are relational, meaning that data is added together or displayed as ratios.
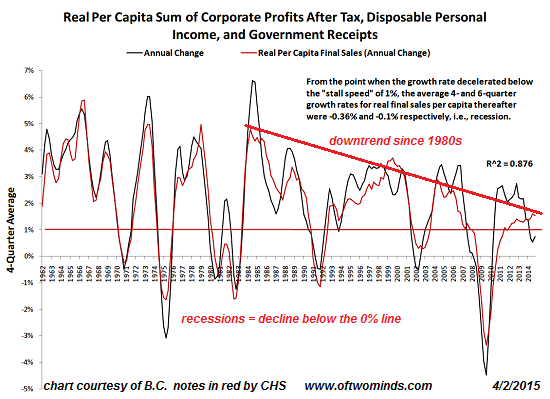
The first chart shows per capita corporate profits + disposable personal income + government receipts and real final sales. As B.C. notes on the chart: "From the point when the growth rate decelerated below the 'stall speed' of 1% , the average 4- and 6-quarter growth rates for real final sales per capita thereafter were -0.36% and -0.1% respectively, i.e. recession."
I added two notes to the chart: growth rates in both series have been deteriorating since the early 1980s, when financialization began substituting leverage and debt for real growth in the real economy.
Every dip below the zero line aligns with a recession. Once the lines dip below the 1% stall speed line, a negative growth rate follows.
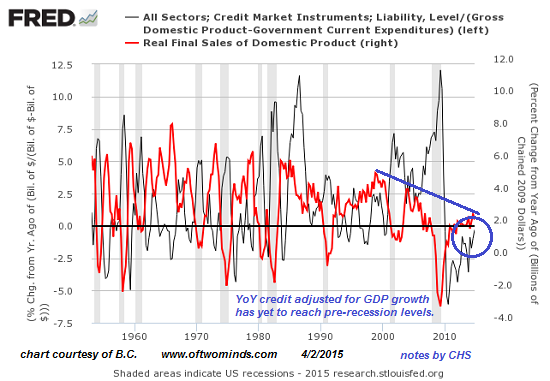
The second chart displays the credit market in a ratio with GDP (minus government expenditures, leaving only the private-sector economy) and real final sales ("real" meaning adjusted for inflation).
Adjusted for GDP growth, the credit market growth has yet to reach pre-Great Recession levels. This reflects debt saturation--adding debt no longer generates much expansion in the economy.
The growth rate of real final sales have been declining since the early 1980s, with each peak and each trough being lower than the previous peaks and troughs. The growth rate in the current recovery has barely edged over the stall speed of 0% and is now rolling over.
B.C. added this commentary on the two charts: The primary inference is that the real, after-tax income component of real GDP decelerated to "stall speed" and then a recessionary rate in Q3-Q4 '14.
With the increase in the US$, net exports will be a drag, even with the collapse in oil imports as a result of the shale oil boom/bubble. That leaves . . . an expansion of the fiscal deficit, all else equal, to prevent recession, or a contraction of nominal GDP with the marked deceleration of CPI and the GDP deflator.
Because we don't have net savings, the Fed will have to resume printing bank reserves for Too Big to Exist (TBTE) banks to resume buying federal bond issuances ("monetization") at some point later this year.
This long-term weakening of the economy is the direct result of financialization and the Federal Reserve's policy of propping up impaired debt with more debt and constantly bringing demand forward with zero interest rates.
NOTE: Contributions/subscriptions are acknowledged in the order received. Your name and email remain confidential and will not be given to any other individual, company or agency.
|
Thank you, Melissa C. ($5/month), for your fabulously generous contribution to this site-- I am greatly honored by your steadfast support and readership. |