
|
|
| weblog/wEssays archives | home | |
|
Doom, Gloom or Boom? (November 13, 2006) Whether you're a confirmed Bull or Bear, it behooves us all to constantly question our beliefs. As I have documented here, I fully expect the housing bubble to burst in a slow-motion crash which will take down the U.S. economy and very possibly the global economy. But being a slow-motion crash, events will take years to transpire. In the meantime, as I have also noted here, Is The Dow Poised to Break Out?, the stock market may follow the pattern set in earlier secular Bear markets by running up in one final sprint before the ultimate collapse in valuations. Let's revisit that thesis. Here is a chart of the Dow Jones Industrial Average. Yes, it is a narrow selection, even an arbitrary selection, of large-cap stocks, but the much broader S&P 500 looks remarkably similar. 
The bulls and the bears are currently engaged in an epic tug of war. As we can see in this chart, the DJIA formed a classic double bottom in July, presaging the massive runup to the present. (Would that I had been smart enough to buy calls back in late July, but alas; at the time, my Bear blinders were firmly in place.) The question isn't, at least to my mind, if the U.S. economy will stumble into a deep recession due to the implosion of the housing debt bubble, but when. Nonetheless, as investors seeking to better our financial place in a dangerous and uncertain world, we must ask: could the market be poised for a final run to the stars? The answer is anything but clear. This chart clearly shows the market is in an uptrend, which is bullish, and that the market has recently bounced off the trendline, maintaining its bullish trend. So far so good. But there is a disturbing double-top formation just below the 12,200 line, which suggests that the bulls' powers are waning. 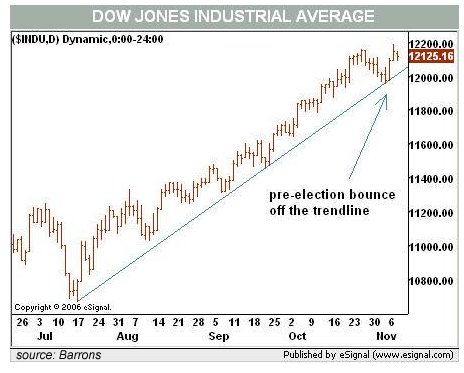 Could this be the "pause that refreshes"? Some analysts see this as a sign of
strength, as by all rights, the DJIA should have dropped back in a significant retrace
by now--and a logical support level would be its previous high at 11,723.
Could this be the "pause that refreshes"? Some analysts see this as a sign of
strength, as by all rights, the DJIA should have dropped back in a significant retrace
by now--and a logical support level would be its previous high at 11,723.
Instead, the worst that the bears have managed is a brief dip to the trendline, which held as support. This weakness, in other words, has yet to break the trendline. If this is the expected retrace, then the market could be setting up another sharp leg upward. On the other hand, the double top suggests it might be poised to break decisively through the trendline. This week may well provide the data which will trigger either the meltdown through the trendline many expect, or a resumption of the solid uptrend. Either scenario is supported by the charts. Frequent contributor Harun I. kindly sent in this chart, which shows a negative divergence in the MACD (moving average convergence-divergence) and a subtle failure in the uptrend to reach into its upper channel. 
What will settle the tug of war? perhaps the inflation and retail sales data due Tuesday and Wednesday. If the PPI and CPI (producer price index and the consumer price index) reveal undertows of inflation, the market might well sell off sharply on fears that the Fed will be forced to raise rates yet again. If retail sales drop through the floor, then the market may well sell off on fears that the dreaded recession is already upon us. If these data (cooked, broiled, poked and massaged as they are) show inflation as a no-show and retail sales as surprising to the upside, that might light a fire under the market. So stay sharp Tuesday. Even if you're only an observer, it should be an interesting week. IMPORTANT NOTE: in the interests of disclosure, please note that this does not constitute a recommendation to buy, sell or even own any security, option, futures contract, pork belly, side of beef, tofu future, foreign currency, quatloos, container of corn or indeed, anything tangible or intangible. I really don't know what's going to happen, so for goodness sake, do not misconstrue this as guidance. It isn't. It's commentary only. You'll have to make up your own mind, based on your own analysis, judgment, intuition, etc. For what it's worth I do hold calls on the DJIA (75 cents each) and NEM (Newmont Mining) (60 cents each) and long positions in APC (Anadarko Petroleum) (at $44) and MDG (a gold mining company) (at $26). But I might liquidate these positions at 9:31 a.m. Monday and go short on something else, do don't put any credence in what I own (or don't own) at any given moment. A monkey throwing darts at a listing of stocks would do as well and very likely much better than I will. But since everyone is supposed to disclose their positions, I don't want to be left out--so there it is, my idiocy is in full view. For more on this subject and a wide array of other topics, please visit my weblog. copyright © 2006 Charles Hugh Smith. All rights reserved in all media. I would be honored if you linked this wEssay to your site, or printed a copy for your own use. |
||
| weblog/wEssays | home |