
|
|
| weblog/wEssays | home | |
|
Are We Poor Or Prosperous? (February 21, 2006) 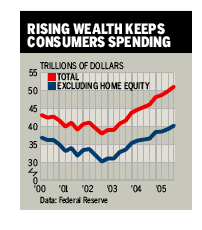 Are we in over our heads in debt and heading for the poorhouse, or are we flush
with trillions in easy cash, just waiting to be lavished on more goods and services?
Shouldn't the answer be obvious? It is to those happy-happy sources like
BusinessWeek which provide a steady supply of reasons why everything economy-wise
is just peachy, or even super-peachy.
Are we in over our heads in debt and heading for the poorhouse, or are we flush
with trillions in easy cash, just waiting to be lavished on more goods and services?
Shouldn't the answer be obvious? It is to those happy-happy sources like
BusinessWeek which provide a steady supply of reasons why everything economy-wise
is just peachy, or even super-peachy.
Supporting the peachy cause is BusinessWeek's little chart of rising wealth (right) and their accompanying article Why More Households Are Feeling Flush. The thesis is simple: household wealth has climbed by $10 trillion since 2001, so no wonder Americans are spending money like water--they're rich and constantly getting richer due to the rise in their housing and stock portfolios. Sounds pleasant, but BusinessWeek left out the important statistic: what percentage of American households are participating in the non-housing part of rising wealth? As we all know, 90% of the non-housing wealth in the U.S. is held by the top 10% of the population, meaning that BusinessWeek's glorious increase in wealth is actually highly concentrated in a few hands, not spread around like their chart might suggest to the unwitting or gullible. A more accurate nationwide look--and a far more sobering one--can be gained by reading a recent piece on Yahoo Finance: Americans' Debt: Worse Than You Think?: According to Kasriel's calculation, last year Americans spent approximately $472 billion more than they earned after taxes -- a negative savings rate of 5.2 percent. That spending is double the previous year -- and a record high.Sounds like 90% of us are heading for debtor's prison, while the 10% who own 90% of the stocks and bonds are feeling just fine. For how long, no one can say, but if the 90% stop spending, how long before the top 10% start feeling a little less wealthy? Put another way--if housing falls apart under an avalanche of foreclosures, how long can stocks keep rising? How long will it take for that "free" $10 trillion in wealth to vanish in a haze of bubble-popping panic? Perhaps not as long as you might think. * * * copyright © 2006 Charles Hugh Smith. All rights reserved in all media. I would be honored if you linked this wEssay to your site, or printed a copy for your own use. * * * |
||
| weblog/wEssays | home |