(June 10, 2008)
A very well-informed correspondent recently asked why interest rates have
barely budged despite the Federal Reserve dropping the Fed Funds rate from
over 5% to 2%. I asked frequent contributor Harun I. to help explain
the relationship, but let's start with standard explanations:
The Federal Funds Rate and How It Works:
Although banks would like to loan out every dollar they can, the Federal Reserve
mandates that they keep a certain amount of cash, or reserve balance, on deposit
at their local Federal Reserve branch office at all times. The federal funds rate
is the rate that banks charge each other for overnight loans of reserve balances.
Each month the Fed, through its Federal Open Market Committee (FOMC), targets a
specific level for the federal funds rate. This rate directly influences other
short-term interest rates, such as deposits, bank loans, credit card interest
rates, and adjustable-rate mortgages.
Longer-term interest rates are indirectly influenced. Usually, investors want
a higher rate for a longer-term Treasury note or bond.
In other words, the Fed sets targets and pulls some monentary levers, but the
price of money is still set by the market.
What The Fed Funds Rate Drop Means For You:
The Fed Funds rate doesnt directly affect mortgage rates.
In simple terms, mortgage rates dropped because investors were pleased at the
Feds decision to lower the Fed Funds rate; when investors are happy and confident
in the US Economy, mortgage rates will generally go down.
The Fed Funds rate is only a target interest rate; in other
words, the Fed doesnt just come out of its meeting and say, "Let the Fed Funds
rate be 4.75%," and it just happens. The Federal Funds Rate is the rate at which
banks lend money to each other, usually overnight, in order to ensure each is
meeting the cash reserves its required to maintain. If one bank has more than
it needs, it lends money to a bank that doesnt have enough; the rate these banks
charge each other is called the Federal Funds Rate. To drive the Fed Funds rate
down, the Federal Reserve, in a roundabout way, pumps cash into the banking system. If banks have more cash, there is less demand for interbank borrowing, which leads to a drop in the Fed Funds rate.
Ideally, the cash the Fed pumps into the banking system will be just enough to
keep the economy balanced. If the Fed pumps too much money in, banks find
themselves with a bit of a surplus, which finds its way into the pockets of you
and me. If everyone has more money, they spend more, which means higher demand
for products and services, which leads to higher prices for products and services,
which is called inflation. So the Federal Reserve has a real balancing act
to play in the US economy.
If inflation starts to increase, mortgage rates will rise again simply because
investors will demand a higher rate of return to counter inflation. So, while
the Interest rate drop will spur the economy in the short term, what happens
in the long term is anyones guess.
Now let's take a look at actual interest and yield rates:
current money rates (forecasts.org)
Prime Rate: 5.00
30 Year T-Bond: 4.75
10 Year T-Note: 4.06
91 Day T-Bill: 1.85
Fed Funds: 1.98
LIBOR 3 Month: 2.70
Mortgage Rate 30 Year: 6.09
What the above explanations hint at but do not address is the role of risk
in setting interest rates. For more on that, let's turn to Harun's comments
and a chart he graciously provided:
The disconnect between long-term rates and the Fed funds rate is
the so-called "conundrum" of the Fed:
"Hey, we are pulling the levers but nothing is happening".
The Fed has lowered rates at the velocity of light and banks still will not lend
to on another. To me this says in no uncertain terms that banks do not like the
risk/reward scenario, i.e. the compensation they would receive (interest) was,
and still is, not worth the risk. Rates should rise until banks feel they are
being adequately compensated for the risk to which they are exposed.
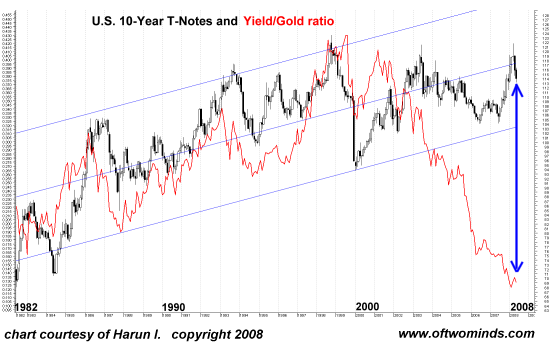
The Bond/Gold ratio chart can be thought of as a spread chart. It essentially
indicates performance based on a condition of being long one asset, in this
case bonds and short another, gold. If the line is going up that means the spread
is narrowing and that you have a successful trade. If the line is going down the
spread is widening and you are in a losing trade.
Historically there has been a coupling or gearing where bond prices moved in
tandem with the RS (relative strength) line, or maintained a relationship with the price of gold
(and commodities), this represents value. Since 2003 an unprecedented decoupling
in this relationship has occurred (the spread has widened beyond anything in my
data set) which indicates that either gold is severely overvalued or bond prices
are overvalued and therefore the risk is undervalued.
The common reasons seem to be that since 2003 money and credit have been expanded
exponentially to unprecedented levels thereby creating unprecedented liquidity
which in turn created distorted (inflated) prices. That the Fed is currently
printing money with reckless abandon is refuted by data that we have seen coming
from sites like Mish, which indicates that the Fed is destroying capital as
rapidly as it is creating it.
But this a recent phenomenon and only creates
stasis. What the Fed has been fighting is a delaying action; it has created a
situation where losses can still be hidden but the previous excess of liquidity
created by previous monetary policy still exists. Interest rates as indicated by
relative performance to gold should be much higher or the price of gold
should be much lower; the chart is clear and irrefutable.
There are also simpler reasons. Investors are flocking to bonds in a flight to
safety driving the prices up and yields down. This is exacerbated by technical
buying that is triggered by price movement but ignores value.
The empirical evidence (the current ongoing calamity in debt markets) suggests
that interest rates should indeed be higher. The RS charts are quietly and
dispassionately indicating fraud, whether consequential or intentional I will
leave for others to decide.
If the Fed were not accepting junk as collateral and an asset's risk of holding
had to be assessed by free market forces, I believe this condition would have
corrected by now or at least the process would be well underway.
Here is what I do know:
At some point the relationship will normalize.
This may happen slowly or swiftly and it can happen in several ways:
Gold can fall in price while bonds stay the same or rise.
Bonds can fall in price while gold either stays the same or rises.
Gold can fall in price and bonds can fall in price but do so at a greater rate
than gold.
Bonds and gold can rise in price but with bonds doing so at a greater rate
relative to gold.
There are probably are more permutations but you get the idea.
Regardless of the why, which may not be fully understood for some time, we know
that:
1. There is an unprecedented mispricing of assets.
2. Normalization will occur, catastrophically or gradually.
3. We have our charts to see when this is occurring and can position to take
advantage.
To clarify my understanding, I asked Harun to explain the relationship between
bond prices and yields:
A bond's coupon yield, or nominal yield, is set at issuance and printed on the face of the bond. The nominal yield is a fixed percentage of the bond's par value. A coupon of say 6%, indicates a bondholder is paid $60 in interest annually until the bond matures.
Current yield (CY) measures a bond's coupon payment relative to its market price (Coupon payment / Market price = Current Yield).
Bond prices and yields move in opposite directions: as bond prices rise, yields decline and vise versa. When a bond trades at a discount, its current yield increases; when it trades at premium, it current yield decreases.
Example: A 6% coupon bond trading at $750 has a current yield of 8% ($60 / $750 = 8%). Conversely, the current yield of a bond bought at a premium is lower than its nominal yield. If you bought a 6% bond for $1,200 you receive a 5% current yield ($60 / $1,200 = 5%).
So when interest rates shot up in the early 1980s, the yields on newly issued bonds
was high (15%) and as a consequence the market value of old bonds yielding 6% was
essentially destroyed (dropped to mere pennies on the dollar).
What could cause the interest-rate repricing Harun suggested is inevitable?
Here are some fundamental issues that come to mind:
1. The risk of loaning money backed by declining real estate is finally
priced in. Once the government guarantees against default or price deflation
are exposed as worthless, then what will the price of mortgage money be? How
about 12%? That was the "average" "typical" cost in the mid-1980s and by no
means "impossible."
2. The global "savings glut" which supposedly created the global
real estate bubble vanishes. Asset destruction/deflation and recession
will remove trillions of dollars from the global system, and like anything which
has become scarce, money will become dearer.
3. Peak oil/stubbornly high oil prices/demand will spur investment in
alternative energy even as they drain money from global savings. If you have
to spend twice as much on oil and goods which depend on oil for transportation
and manufacture (i.e. everything), then you have less to save. And if everyone
has less to save, then the pool of capital available for investment shrinks.
With virtually every major government borrowing hundreds of billions in deficit spending,
reduced global savings and asset deflation, we have increased demand for
borrowing as the pool of available capital is shrinking. That supply/demand
imbalance guarantees rising prices for money--higher interest rates.
Based on the above, I would hazard a guess that interest rates could very easily double
and then triple: mortgages will shoot from 6% to 12%, and the interest on government
debt will skyrocket, diverting tax revenues away from other government spending.
Interestingly (at least to me), Harun's chart and commentary point to the same
possibility.
NOTE: contributions are acknowledged in the order received. Your name and email
remain confidential and will not be given to any other individual, company or agency.
Thank you, Cheryl A. ($25), for your unexpected and very generous donation
via mail of the book The Great Wave by David Hackett Fischer.
I am greatly honored by your support and readership.
For more on this subject and a wide array of other topics, please visit
my weblog.
All content, HTML coding, format design, design elements and images copyright ©
2008 Charles Hugh Smith, All rights
reserved in all media, unless otherwise credited or noted.
I would be honored if you linked this wEssay to your site, or printed a copy for your own use.
