|
|
|
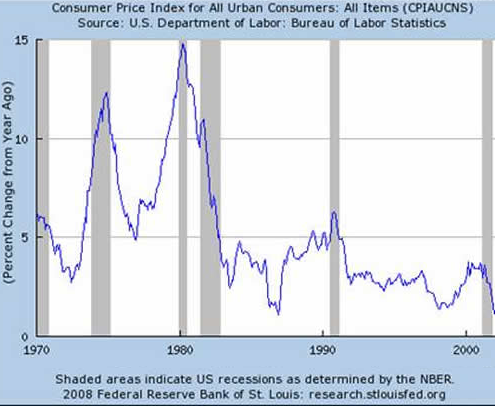
Will Housing Provide a Hedge in Inflationary Times? (June 17, 2008) Rising inflation is no secret, nor is the fact that periods of low inflation give rise to periods of high inflation. (By "inflation" I mean what is measured by the Consumer Price Index, not a monentary definition.) In past eras of high inflation like the 1970s, tangibles such as gold and real estate provided good hedges against the ravages of inflation, while stocks and bonds lost about 2/3 of their adjusted-for-inflation value. In other words, paper-money assets sank, tangible assets rose. Given this history, some are suggesting/hoping that high inflation may reflate the housing bubble as investors rush into tangible assets as hedges against inflation. Perhaps--but we also have to look at employment, which is the foundation of the housing market and indeed all consumer borrowing/spending.
Our analysis begins with four charts:
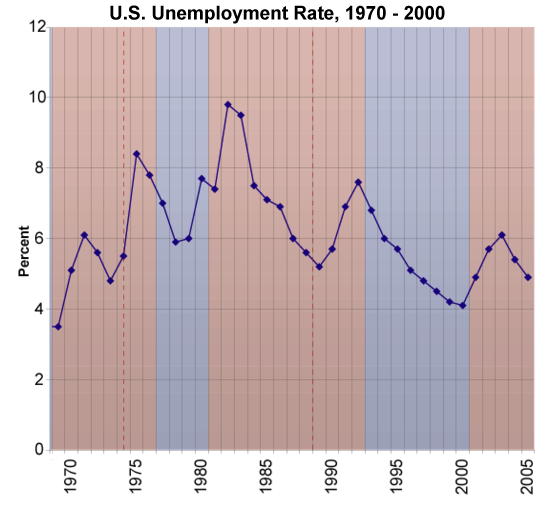
By comparing these charts, we can discern if there appears to be any correlation between inflation/CPI, housing values, and unemployment.
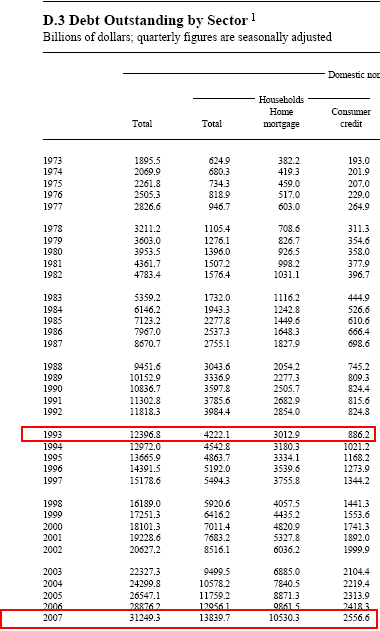
In the 1970-2000 time frame, there does seem to be a direct correlation between house prices and the CPI and unemployment. The correlation matches a common-sense causality: when unemployment falls (the economy is strong) and the CPI rises, then house prices rise. When unemployment rises (weak economy) and the CPI falls, then housing values have declined. But the housing bubble of the 2000s ran counter to both these correlations. As we can see in the last chart of California home prices, housing rose spectacularly in a low-unemployment, low-inflation era. So what happens when both the CPI and unemployment are rising, as they are now? Weak employment reflects a weak economy, and in the past that has led to falling house values as buying/demand declines. Rising CPI has in past decades led to rising real estate prices, as investors prefer tangible assets over paper assets. Could this trend re-assert itself in the near future? For further illumination, we turn to a recent excellent post from our colleague Dr. Housing Bubble, and this chart of household mortgage and consumer debt the Doctor posted:
The most astounding--and obvious--conclusion to be drawn from this data is the constant rise in debt, regardless of what the economy or the CPI are doing. Household debt has risen rain or shine; and as the good Doctor explains in this post, combine this with negative savings rates and declining home equity, and you get this conclusion: The average household has no assets to invest in housing. Whatever assets they do have are trapped in a declining-value house or 401K/IRA retirement accounts. The MSM cheerleaders are always claiming the negative savings rate of the U.S. is misleading, as most household "savings" now reside in 401K or IRA retirement funds. But this is nonsense; a retirement nestegg is not a "rainy day" savings account, though people are paying the horrendous penalty and pulling money out of retirement accounts as if they were savings. Furthermore, you can't plunk your 401K or IRA cash down on a house or condo. You can buy shares in a REIT, perhaps, as an indirect investment in commercial real estate, but 401K/IRA "savings" cannot be used to buy houses as inflation hedges. Put another way: the big difference between the 1970s and 80s and the present is the stupendous overhang of consumer debt. In a normal business cycle, periods of falling employment and GDP are characterized by lower borrowing and increased savings/thrift, which then act to rebuild the capital needed to fuel lending in the next business cycle uptrend. Unfortunately for the "housing will rise as an inflation hedge" theory, this did not happen in the brief 2001-2002 down-cycle of the dot-com collapse/recession. Instead, debt exploded in a less-than-inflation-interest rate environment and "the looser the better" lending free-for-all. Note that total debt more than doubled from the dot-com top in 1999 ($6.4 trillion) to $12.95 trillion in 2006, the top of the housing bubble. In sum: housing is now a capital trap, and all the debt taken on in the 2000s limits future household investments in housing, regardless of rising CPI. The debt bubble and the bubble in housing inventories have created massive supply/demand imbalances; there are few willing, creditworthy buyers and far too many houses for sale/in foreclosure. Even more ominous, as unemployment rises we can anticipate that the historical correlation between unemployment and falling housing values will re-assert itself, adding more inventory to the "houses for sale" as the recession deepens and unemployment continues to rise. Those with actual savings to invest may well be seeking a hedge against rising CPI, but there is little evidence that real estate will provide such a hedge. Thank you, Don E. ($13), for your kind and unstinting support of this site. I am greatly honored by your support and readership. All contributors are listed below in acknowledgement of my gratitude. NOTE: contributions are acknowledged in the order received. Your name and email remain confidential and will not be given to any other individual, company or agency.
Thank you, Amy C. ($20), for your very kind encouragement and generous contribution to this
site.
I am greatly honored by your support and readership.
For more on this subject and a wide array of other topics, please visit my weblog. All content, HTML coding, format design, design elements and images copyright © 2008 Charles Hugh Smith, All rights reserved in all media, unless otherwise credited or noted. I would be honored if you linked this wEssay to your site, or printed a copy for your own use. |
| consulting | blog fiction/novels articles my hidden history books/films what's for dinner | home email me | ||