One True Measure of Stagnation: Not in the Labor Force
October 6, 2015
This is a stark depiction of underlying stagnation: paid work is not being created as population expands.
Heroic efforts are being made to cloak the stagnation of the U.S. economy. One of these is to shift the unemployed work force from the negative-sounding jobless category to the benign-sounding Not in the Labor Force (NILF) category.
But re-labeling stagnation does not magically transform a stagnant economy. To get a sense of long-term stagnation, let's look at the data going back 38 years, to 1977.
NOT IN LABOR FORCE (NILF) 1976 to 2015
I've selected data from three representative eras:
-- The 20-year period from 1977 to 1997, as this encompasses a variety of macro-economic conditions: five years of stagflation and two back-to-back recessions (1977 - 1982), strong growth from 1983 to 1990, a mild recession in 1991, and growth from 1993 to 1997.
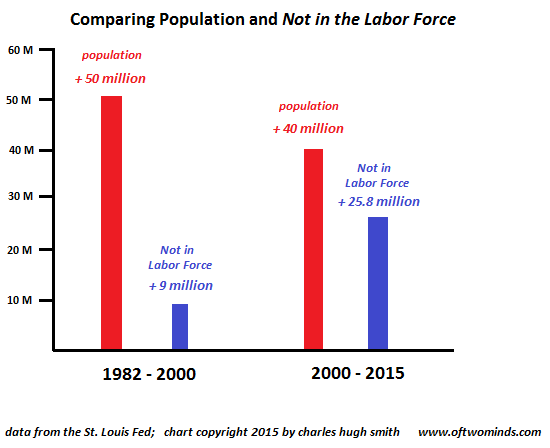
-- The period of broad-based expansion from 1982 to 2000
-- The period 2000 to 2015, an era characterized by bubbles, post-bubble crises and low-growth "recovery"
In all cases, I list the Not in Labor Force (NILF) data and the population of the U.S.
1977-01-01: 61.491 million NILF population 220 million
1997-01-01 67.968 million NILF population 272 million
Population rose 52 million 23.6%
NILF rose 6.477 million 10.5%
1982-07-01 59.838 million NILF (start of boom) population 232 million
2000-07-01 68.880 million NILF (end of boom) population 282 million
Population rose 50 million 21.5%
NILF rose 9.042 million 15.1%
2000-07-01 68.880 million NILF population 282 million
2015-09-01 94.718 million NILF ("recovery") population 322 million
Population rose 40 million 14.2%
NILF rose 25.838 million 37.5%
Notice how population growth was 23.6% 1977-1997 while growth of NILF was a mere 10.5% As the population grew, job growth kept NILF to a low rate of expansion. While the population soared by 52 million, only 6.5 million people were added to NILF.
In the golden era of 1982 - 2000, population rose 21.5% while NILF expanded by 15%. Job growth was still strong enough to limit NILF expansion. The population grew by 50 million while NILF expanded by 9 million.
But by the present era, Not in the Labor Force expanded by 37.5% while population grew by only 14.2%. This chart shows the difference between the two eras: those Not in the Labor Force soared by an unprecedented 26 million people--a staggering 15.6% of the nation's work force of 166 million. (Roughly 140 million people have some sort of employment or self-employment, though millions of these earn less than $10,000 a year, so classifying them as "employed" is a bit of a stretch).
This is a stark depiction of underlying stagnation: paid work is not being created as population expands. Those lacking paid work are not just impoverished; they lose the skills and will to work, a loss to the nation in more than economic vitality.
NOTE: Contributions/subscriptions are acknowledged in the order received. Your name and email remain confidential and will not be given to any other individual, company or agency.
|
Thank you, David J. ($100), for your outrageously generous contribution to this site -- I am greatly honored by your support and readership. |
Thank you, Donald c. ($50), for your sumptuously generous contribution to this site -- I am greatly honored by your support and readership. |

Discover why Im looking to retire in a SE Asia luxury resort for $1,200/month.