|
|

|
|||||||||||||
|
The Housing Bubble Broke the Middle Class (April 27, 2011) The bursting of the housing bubble wiped out half of the net worth of the Mortgaged Middle Class. On the face of it, American households were not that affected by the bursting of the housing bubble. If we look at the Fed Flow of Funds report, the Balance Sheet of Households and Nonprofit Organizations, we find that net worth only declined by about 11% ($7.3 trillion) from 2007 to 2010: a $2.9 trillion decline in financial assets and a $4.9 trillion decline in tangible assets, i.e. real estate and consumer durable goods. Here are the basic numbers, rounded, in trillions:
total assets:
Real estate:
Mortgages:
Consumer credit:
Owners equity as percentage of real estate:
Corporate equities and mutual fund shares:
Treasury securities: Cash clicked up a bit:
Savings and money market funds: On the surface, this rise in income looks good, too bad the increase is mostly Federal transfers of borrowed money:
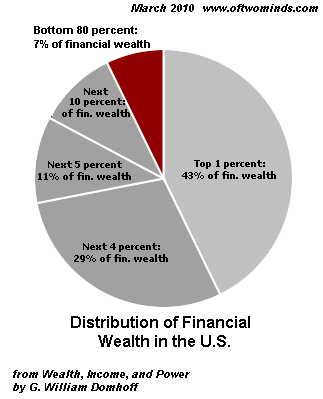
Disposable personal income (SAAR): If we look beneath the surface at the distribution of wealth, the picture isn't so benign. Over the years I have often posted the basic facts of wealth distribution and housing in the U.S., for example Will Delinquencies Trigger a New American Revolution? (April 7, 2008). The numbers have changed from 2008, of course, but the basic outlines and percentages have not. Beneath the surface, most of the income and wealth is held by the top 10% of households. Over a quarter of households are at or below the poverty line; they have no appreciable assets and depend heavily on government transfers. Almost half of the total income (47%) goes to the top 10%, and 21% flows to the top 1%. Over 18% of personal income is transfers from the Federal government, most of which is borrowed, of course: Reliance on Uncle Sam hits a record :
A record 18.3% of the nation's total personal income was a payment from the government for Social Security, Medicare, food stamps, unemployment benefits and other programs in 2010. Wages accounted for the lowest share of income 51.0% since the government began keeping track in 1929. If we extrapolate the additional 6% increase in transfers, that comes to $700 billion. So roughly 70% of the increase in personal income was simply money borrowed by the Federal government (recall the $1.6 trillion annual Federal deficit) and distributed to the citizenry. In other words, people aren't making more money--the Central State is simply borrowing more and it's being counted as "income" when it's distributed. There are about 105 million households in the U.S. and about 72 million owner-occupied dwellings. Roughly 25 million are owned free and clear, and 48 million have a mortgage. Let's look at homeowner's equity, which stands at 38.5%. Equity is what's left if you sell your house and pay off the mortgage. About 27% of all homeowners (13 million) are underwater, i.e. their house is worth less than their mortgage. This is called negative equity, but in practicality it means zero equity. Since a third of all homes are owned free and clear, then their equity is 100%. Assuming a broadly even distribution of these homes owned without mortgages (most likely, the majority are owned by elderly people who paid off their mortgages), then we can conclude that 33% of total owner's equity resides in these homes owned free and clear. That leaves 5.5% of total equity spread among the 35 million mortgaged homes which are not underwater. Calculated another way: household real estate is worth $16.4 trillion, and there is $10 trillion in outstanding mortgage debt, so total equity is $6.4 trillion. One-third of homes are owned free and clear, so one-third of $16.4 trillion is $5.4 trillion. $6.4 trillion - $5.4 trillion = $1 trillion in equity spread over 35 million homes. That's not much--roughly 1.8% of all household net worth. The family house was the traditional foundation of household wealth. As for all those trillions in financial wealth--as we all know, 83% is owned by the top 10%.
So here's the reality: over one-fourth of all households are at or below the poverty line: 28 million. The top 10%--10.5 million households--own the vast majority of the financial assets ($45 trillion)(the total owned by non-profits is not broken out). The next 10% own 10% of this wealth, or about $4 trillion. So the top 21 million households own 93% of all financial wealth. The Great Middle Class between those in poverty and the top 20%--56 million households-- owns about $2.7 trillion in financial wealth, and the millions with mortgages own an additional $1 trillion in home equity. That comes to $3.7 trillion, or about 6.5% of the total household net worth. Consumer durables--all the autos, washing machines, jet-skis, etc.--are worth about $2.2 trillion ($4.6 T = $2.4 T in consumer debt). Add the durables and the other wealth, and the Great Mortgaged Middle Class holds about 10% of the total household wealth ($5.9 trillion). Before the housing bubble, households owed about $5 trillion in mortgages. The housing bubble came along, introducing the fantasy of home-as-ATM-cash-withdrawal-machine, and mortgages ballooned to over $10 trillion. Back at the top of the bubble, the middle class had $6 trillion more assets on the books. Considering the Mortgaged Middle Class now owns about $6 trillion in net assets, then the bursting of the housing bubble caused their net worth to drop by 50%.
I'm not making any political statement here--these are the numbers.
Of Two Minds Kindle edition: Of Two Minds blog-Kindle

"This guy is THE leading visionary on reality.
He routinely discusses things which no one else has talked about, yet,
turn out to be quite relevant months later."
NOTE: contributions are acknowledged in the order received. Your name and email remain confidential and will not be given to any other individual, company or agency.
Or send him coins, stamps or quatloos via mail--please request P.O. Box address. Subscribers ($5/mo) and contributors of $50 or more this year will receive a weekly email of exclusive (though not necessarily coherent) musings and amusings, and an offer of a small token of my appreciation: a signed copy of a novel or Survival+ (either work admirably as doorstops). At readers' request, there is also a $10/month option. The "unsubscribe" link is for when you find the usual drivel here insufferable.
All content, HTML coding, format design, design elements and images copyright © 2011 Charles Hugh Smith, All rights reserved in all media, unless otherwise credited or noted. I would be honored if you linked this essay to your site, or printed a copy for your own use. |
Add oftwominds.com to your reader:
|
| Survival+ | blog fiction/novels articles my hidden history books/films what's for dinner | home email me | ||