|
|

|
|||||||||
|
Why We Keep Getting Poorer: High-Cost Housing (February 4, 2010) The reason why we're poorer: more of our income goes to housing than it did 35 years ago. Simply put: housing costs have far outpaced household incomes over the past 35 years, making the high cost of housing the primary driver of declining discretionary income: what's left after paying taxes and housing. You might want to refill your coffee or tea cup because we have to slog through some potentially confusing numbers to root out the truth. There is information in the difference between median income and mean/average income. Median is the number at the 50% line, e.g. first half of households earning less than the median household income and the other half earning more. ( wikipedia on median/mean) Mean income (average) is the amount obtained by dividing the total aggregate income of U.S. households by the number of households. Consider that the median income of U.S. households in 2008 was $50,303 while the average income was $68,424. (Source: U.S. Census Bureau Table H-6. You have to download the h06AR Excel file to obtain 2008 data.) Why the big difference? The higher income households earn a much greater income that the lower 4/5 of households. That preponderance of income in the top 5% and top 20% causes the average income to be much higher than the median. We need to ask not just much more do higher-income households earn that middle-income households, but how much has each group's income risen in the past 35 years? In other words: has income risen equally across all incomes, or has it risen more in one group or another? The Census Bureau divides the households into quintiles--20% each, with a special category for the top 5%. (income by quintile.) The numbers are remarkable. I am not making a judgment here, i.e. that incomes "should be" different from these facts; we all know wages for low-skill jobs have stagnated while high-pay, low-skill factory positions have declined due to global wage arbitrage and broad post-industrial trends. Nonetheless, it is clear that the vast majority of income increases have accrued to the top 20% and top 5%. Here are the numbers, adjusted into 2001 dollars (data ends at 2001):
Bottom 20%
Middle 20% a.k.a. "the middle class"
Top 20%
Top 5% a.k.a. "the wealthy"
Now let's move on to look at housing. Our statistics are once again drawn directly from U.S. Census Bureau data: median house prices 1975-2009. The average house price in 1975 was $39,500. Using the Bureau of Labor Statistics inflation calculator, we find that comes to $158,000 in 2008 dollars. The average (mean) house price in December 2008 was $301,200--almost twice the 1975 cost. To be exact, 90.7% higher. Thus we can see that only the top 5% of households actually gained enough income to match the rise in housing costs. Even the "upper middle class" in the top 20% of households only gained 74%, substantially less than the 90% rise in housing. The lower 3/5 of the households were completely blown out of the water by housing's 90% rise; obviously, their ability to afford a house was essentially destroyed by this asymmetric rise in the cost of housing. I want to note that all these numbers are adjusted for inflation; they are all "apples to apples." Now let's consider a popular metric of housing affordability: gross income to the cost of a house. According to mybudget360.com, the home price/income in 1950 was 2.21 and 2.11 in 1960. In other words, a house cost 2.1 years of income in 1960. Here is my analysis of the Census data median house prices 1975-2009.
1975: median income $42,936, median house price $148,800
1975: average income $50,137, average house price $158,000
Clearly, housing affordability had already dropped substantially from 1960 to 1975.
2008: median income $50,303, median house price $245,300
2008: average income $68,424, average house price $301,200
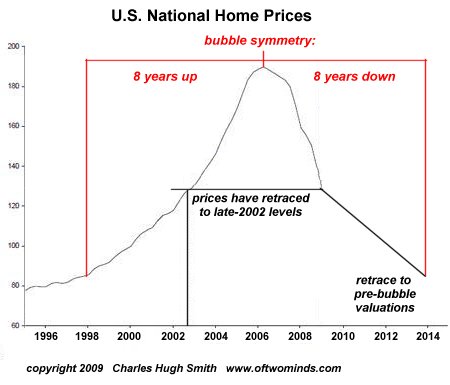
However you want to slice it, housing costs substantially more in terms of income than it did 35 years ago. While the final Census Bureau numbers are not yet available, private data suggests median income dropped in 2009 as the recession took hold, returning household incomes to 1997 levels. (Source: davemanuel.com) Meanwhile, according to Census data, the average house price in December 2009 was $290,000--a mere 3.7% decline from the 2008 price of $301,200. As income drops and Federal tax credits and Federal Reserve support of the mortgage markets continue propping up historically asymmetric housing prices, affordability will continue to decline. If average house prices were to return to the 1975 ratio of approximately 3 times average household income, than would require the average price to drop from $290,000 to around $195,000. (Assuming real average household income has declined to around $65,000, a number which may well be optimistic.) To all those who believe demand for housing will soon exceed supply, recall that the Census Bureau counts almost 19 million empty dwellings in the U.S. even as foreclosures are slated to reach 4 million in 2010. A decline to the 3-to-1 ratio of income to price fits in with my projection for housing bubble symmetry:
Here is a pie chart of wealth distribution/ownership:
DailyJava.net
is now open for aggregating our collective intelligence.
Of Two Minds is now available via Kindle:
Of Two Minds blog-Kindle

"This guy is THE leading visionary on reality.
He routinely discusses things which no one else has talked about, yet,
turn out to be quite relevant months later."
NOTE: contributions are acknowledged in the order received. Your name and email remain confidential and will not be given to any other individual, company or agency.
Or send him coins, stamps or quatloos via mail--please request P.O. Box address. Your readership is greatly appreciated with or without a donation.
For more on this subject and a wide array of other topics, please visit
my weblog.
All content, HTML coding, format design, design elements and images copyright © 2010 Charles Hugh Smith, All rights reserved in all media, unless otherwise credited or noted. I would be honored if you linked this wEssay to your site, or printed a copy for your own use. |
|
| consulting | blog fiction/novels articles my hidden history books/films what's for dinner | home email me | ||