|
|

|
||||||||
|
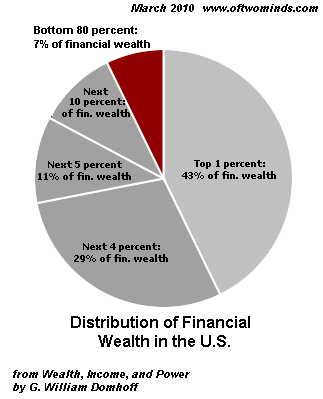
Fed's QE2 Misadventure Costs U.S. Households $4.6 Trillion (November 10, 2010) The Fed's Quantitative Easing Part 2 has destroyed $4.6 trillion in household wealth, all to boost the stock portfolios of the top 10%. The Federal Reserve's stated goals in launching QE2 were to trigger a "wealth effect" and boost inflation. The net result of their program is a massive destruction of household wealth. The basic idea is that goosing "risk assets," i.e. stocks, then consumers will feel wealthier and thus motivated to open their wallets and spend, spend, spend. This spending won't be based on any increase in income (household income fell in 2009 despite the massive run-up in stocks) but on the illusion of greater wealth created by a temporarily rising stock market. The Fed must be aware that the top fifth of households collects 50.3% of all pre-tax income and the bottom two-fifths receive 12%, so the "wealth effect" is in essence another "trickle down" scheme in which the top earners buy more handbags manufactured in China and the bottom 80% of Americans are supposed to benefit by being hired to stock the shelves with Elite goods. As I often report, only the top 10% of households own enough equities to feel wealthier; so the Fed's central faith is doubly a "trickle down" theory: only the top 10% can possibly experience a wealth effect.
But the destruction of purchasing power as the Fed destroys the dollar is felt by all households--especially the bottom 80%. The Boiling Frog: Effects of QE2 On The Bottom 80% of the U.S. Population. As I noted in Are the Fed's Honchos Simpletons, Or Are They Just Taking Orders? (November 1, 2010), Quantitative Easing 2 makes no sense. Today I will quantify just how perverse and destructive the Fed's policies have been to U.S. households. The latest snapshot of the household's balance sheet comes from the Fed Flow of Funds for the second quarter (June 30, 2010). If we measure what has happened to the U.S. dollar and the S&P 500 since July 1, then we can measure the effects on the household balance sheet. Let's collect a few key numbers from the Balance Sheet of Households and Nonprofits. All numbers are as of June 20, 2010 (Q2 2010). Real estate: $18.8 trillion, down from $24.9 trillion in 2006 (bubble top) Total financial assets: Q2 2010 $43.7 trillion, down from $50.6 trillion in 2007 (pre-recession) Deposits (cash): $7.55 trillion, down from $7.9 trillion Credit market instruments: (bonds etc.) $4.3 trillion, up from $4 trillion in 2007 Corporate equities (stocks): $6.7 trillion, down from $9.6 trillion in 2007 mutual fund shares: $4 trillion, down from $4.5 trillion in 2007 Liabilities (debts, mortgages, etc.): Total liabilities: $13.9 trillion, down from $14.4 trillion home mortgages: $10.15 trillion, down from $10.5 trillion Net worth: $53.5 trillion, down from $64.2 trillion, a decline of $10.7 trillion So mortgage debt decreased by a trivial $.35 trillion, total liabilities decreased by a modest $.5 trillion, and net worth declined by a whopping $10 trillion. Most of the mortgage and debt declines result from write-downs of debt by lenders, not from households paying down debt. In other words, after suffering a staggering 17% decline in net worth, households managed to write down or pay down a tiny 3.4% of their liabilities. Disposable personal income: $11.3 trillion, up from $10.4 trillion. As noted above, the increase flowed to the top 20%, as median income has declined by almost 5%. Homeowners equity: $6.9 trillion, down from $12.8 trillion in 2006. So homeowners have lost roughly $6 trillion in home equity: about 60% of the total decline in net worth. Since the bottom 80% have few financial assets (stocks and bonds) then this destruction of home equity means their only real asset base has been largely wiped out. Owners equity as a % of household real estate: 40.7% As I have noted before. since a third of all homes are owned free and clear, then 33% of the 40% equity left in homes results from homes with no mortgage, and thus a mere 7% of equity is all that's left for the 2/3 of homes with mortgages: 7% of $18.8 trillion (total value of all household real estate) equals $1.3 trillion in equity for the 50 million homes with mortgages. Now let's calculate the decline in purchasing power as the Fed purposefully depreciated the U.S. dollar: Decline in the dollar since July 1, 2010: 12.2% Decline in value (purchasing power) of all household assets since June 1: (12.2% of non-equities net worth--$42.8 trillion) -$5.2 trillion Decline in value (purchasing power) of household disposable personal income: (annualized: 12.2% of $11.3 trillion): -$1.4 trillion And exactly how much did household wealth in stocks rise as the dollar was crushed? Rise in S&P 500 since July 1, 2010: 19% Increase in net worth of equities from July 1: (19% of $10.7 trillion): +$2 trillion Net loss due to Fed's QE2 (from July 1): -$3.2 trillion. Decline in purchasing power of household disposable personal income (annualized): -$1.4 trillion Total loss inflicted on households by QE2 to date: $4.6 trillion. The Fed's QE2 has been an unmitigated disaster for 90% of American households, as it has destroyed the value of their purchasing power in a Devil's Pact to goose stocks, which only benefits the top 10% of households--and most of those paper gains are reserved for the top 1%.
Those are the numbers; exactly what conclusion can be drawn from them except
the Fed is a horrendously misguided, Elite-dominated
destructive force which must be reined in politically?
Of Two Minds is now available via Kindle: Of Two Minds blog-Kindle

"This guy is THE leading visionary on reality.
He routinely discusses things which no one else has talked about, yet,
turn out to be quite relevant months later."
NOTE: contributions are acknowledged in the order received. Your name and email remain confidential and will not be given to any other individual, company or agency.
Or send him coins, stamps or quatloos via mail--please request P.O. Box address. Your readership is greatly appreciated with or without a donation.
For more on this subject and a wide array of other topics, please visit
my weblog.
All content, HTML coding, format design, design elements and images copyright © 2010 Charles Hugh Smith, All rights reserved in all media, unless otherwise credited or noted. I would be honored if you linked this wEssay to your site, or printed a copy for your own use. |
Add oftwominds.com to your reader:
|
| Survival+ | blog fiction/novels articles my hidden history books/films what's for dinner | home email me | ||