|
|
|
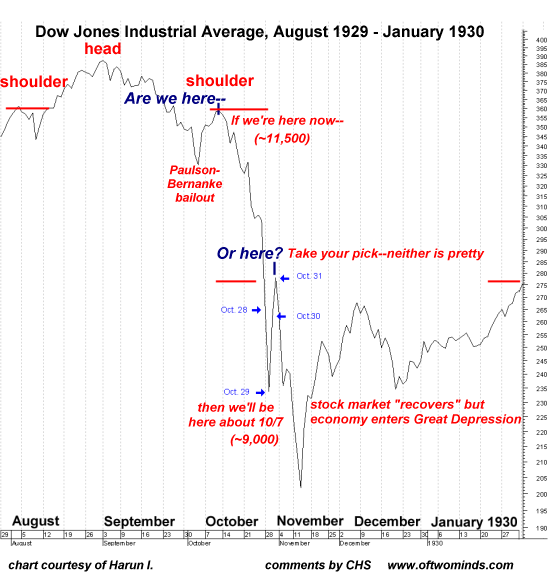
Mark Your Calendars: The Crash of October 7, 2008 (September 22, 2008) If you believe the pundits and mainstream financial press, the Big Fat Giant Bailout has fixed everything and a Bull Market is now running. Let's examine that thesis before swallowing it whole. Tongue gently in cheek I am predicting the wheels come off the fake rally on October 7. My reasoning is presented below, but of course the exact date is unknown; October 7 is as good a guess as any other, but October seems to be the right month. Correspondent azvitt first alerted me to the possible significance of 10/7/08 by sending me this link: urbansurvival.com. Regardless of the day, there are plenty of fundamental reasons to expect the wheels to fall off shortly after the quarter closes on Sept. 30, as fund managers will be desperate to manipulate the market upwards so they can avoid reporting huges losses to their stunned customers/clients. But events may have moved even beyond "big money's" ability to foment their usual close-of-the-quarter rally. Also, the Great Crash of 1929 occurred on a Monday and Tuesday, with Tuesday's climax earning the moniker "Black Tuesday." That is also one reason I have selected Oct. 7 as the Black Tuesday of the Great Crash of 2008--but it could be Monday, October 13, or Sept. 29. Only time will tell. Please read the HUGE GIANT BIG FAT DISCLAIMER below. This is not investment advice, it is informed guesswork, a dart tossed in the darkness that is the future, etc. The The Big Picture ran a chart of the October 1929 crash, but I'd asked frequent contributor Harun for a similar chart even earlier. Let's start with that chart:
I've marked the chart up a bit. Please note the following: 1. Depending on how much rosy fantasy you're willing to swallow, there are two possible analogous points in this chart of the DJIA 1929 and the present: the right shoulder which preceded the Crash, or the first bounce off the Crash. 2. A clear head-and-shoulders top was in place on the DJIA before the Crash. 3. Just for discussion, let's assume 10,460 was not the final low of this Bear Market. In that case, then it is unlikely we've just experienced the "blowout low." But even if you think we have, note how the market bounced and then promptly fell to a much lower low. In other words, whatever analog point you pick, the results are still the same: a huge drop to a catastrophically lower low. Now it could be argued that Sept. 2008 is in no way analogous to Sept. 1929, but there are fewer and fewer "buyers" of that complacent Fantasyland view. Note that though the DJIA seemed to "recover" nicely in the aftermath of the Crash, the "real economy" entered a devastating Depression which was only ended by the unprecedented fiscal stimulus of World War II, 12 years hence. Harun made these exceedingly incisive comments when he forwarded the chart:
The market did recover to levels above the that of the 28th but the economic malaise caused by government intervention lasted until WW II. Part of Paulson's grand new scheme of the government purchasing all the bad debt is lauded as having precedence in the 1930 and the S&L debacle. But buying all the bad paper didn't end the depression and the S&L situation was marginally successful because of a secular bull market that enable that property to be sold over time at a profit or break even. Given all the uncertainties and complete lack of confidence that "everything's fixed now," then it sure looks possible that the Paulson-Bernanke "save the bankers" rally was nothing more than another right shoulder in a downtrend. Let's consider a 3-year chart of the DJIA 2006-08 for more data:
1. What slaps us upside the head first is the painfully obvious head-and-shoulders formation and the equally obvious overhead resistance now posed by the 200-day moving average. 2. When a major moving average crosses beneath a longer-term moving average, it's called "the cross of death" because it confirms a major downtrend. Here we have the 20-day MA absolutely crashing through the 200-day MA, with the 50-day MA dropping not far behind. All three of these basic technical factors pose huge headwinds to any sustainable rally. Recall that stock market valuations are supposedly based on future profits. Exactly where will future robust profits flow from in a wrenching consumer and credit recession? What fundamental expansion in spending and profits will drive a Bull Market from here? To even posit such a rally is ludicrous in the extreme and virtually meritless on every fact-based market driver.
3. Eerily, the DJIA finally surpassed its dot-com-era bubble high of 11,722 (posted
January 14, 2000) almost exactly two years ago. On top of the cross of death,
the 200-day MA and the head-and-shoulders formation, this previous high now poses
huge resistance--resistance that the DJIA has failed to breach multiple times:
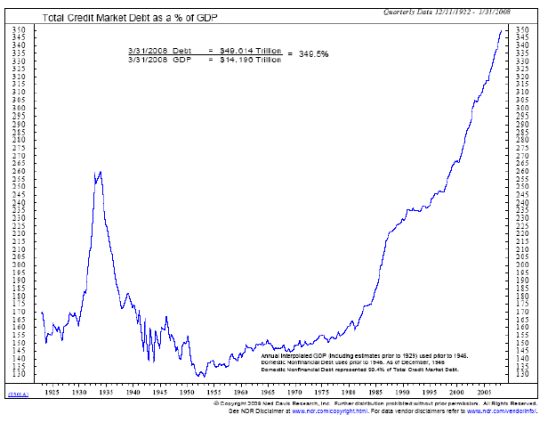
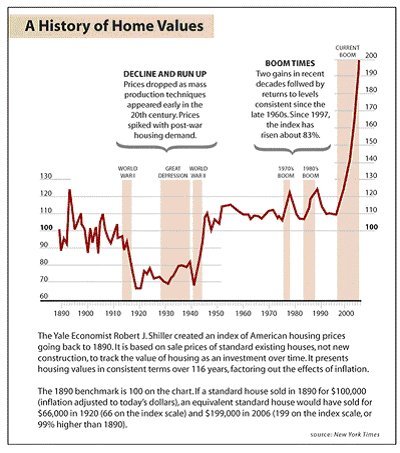
Six attempts and every one failed. The current "rally" may well run up and bounce off the 11,722 level one more time. Once again: exactly what fundamental, sustainable uptrend in future profits would justify a new Bull Market? Hint: Banks being able to borrow from other banks does not mean profits will suddenly leap. 4. When we look at other indicators, we do not see the extremes which usually mark real bottoms. Stochastic readings are far from oversold, and DMI- is well below its recent highs (DMI- is a measure of negative trend, DMI+ a measure of positive trend). The MACD divergence is also at neutral, meaning it is also far from marking a bottom. The last time the 20-day MA crossed the 200-day MA was October 2001--the beginning of a Bear market which took the DJIA from over 10,000 down to 7,200. The 20-day MA did not cross above the 200-day until late 2003--over two years hence. And the hangover from the Y2K/dot-com party was child's play compared to the credit crisis/housing bust/global recession we face now. 5. Virtually all sustainable rallies run from a solid double-bottom. The very best Bull case still requires at the very minimum a retest of 10,460, and the sooner the better. Question: what if Paulson and Bernanke hold a Credit Fix party and nobody comes? What if there is still great reluctance to lend to other institutions come next week? Since Paulson and Bernanke have already pulled the last rabbit out of their magic hats, then what's left to stem the next crisis of faith/credit crunch? Answer: nothing. Do ya reckon market players are keenly aware of this? If credit begins tightening once again after the champagne euphoria of the "rally" fades into hangover, then what will every responsible player do? SELL SELL SELL, exiting long positions as fast as possible, especially in financials. Why? Because there is no way now to hedge the long positions with a corresponding short position. Having banned evil shorts, there won't be any "short covering rally" to stem the cascading sells. It's called "unintended consequences of hastily made, ill-planned financial rescues." Skeptics of a Crash, please review the following charts for the context of what awaits us. Here are five charts without which the present crisis cannot be properly understood/contextualized:
1. total credit as a % of GDP
Add these up and what do you get? Asset deflation, credit deleveraging, consumer recession, corporate profits crash and thus stock market crash. There really is no alternative result of the sum. For more context, here is a summary of Wall Street Crash of 1929 (Wikipedia)
After an amazing five-year run when the world saw the Dow Jones Industrial Average (DJIA) increase in value fivefold, prices peaked at 381.17 on September 3, 1929. The market then fell sharply for a month, losing 17% of its value on the initial leg down. Prices then recovered more than half of the losses over the next week, only to turn back down immediately afterwards.A few books of related interest:
The Long Emergency: Surviving the End of Oil, Climate Change, and Other Converging Catastrophes of the Twenty-First Century
The Black Swan: The Impact of the Highly Improbable
When Genius Failed: The Rise and Fall of Long-Term Capital Management
The Rise and Decline of Nations: Economic Growth, Stagflation, and Social Rigidities
Financial Armageddon: Protecting Your Future from Four Impending Catastrophes
New Book Notes: My new "little book of big ideas," Weblogs & New Media: Marketing in Crisis
"Charles Hugh Smith's Weblogs & New Media: Marketing in Crisis is one of the most important business analyses I have ever read. It is the first to squarely face converging global crises from a business perspective: peak oil, climate change, resource depletion, and the junction of key social cycles will radically alter the business landscape in coming decades...." HUGE GIANT BIG FAT DISCLAIMER: Nothing on this site should be construed as investment advice or guidance. It is not intended as investment advice or guidance, nor is it offered as such. It is solely the opinion of the writer, who is NOT an investment counselor/professional. All the content of this website is solely an expression of his personal interests and is posted as free-of-charge opinion and commentary. If you seek investment advice, consult a registered, qualified investment counselor (As with any other professional service, confirm their track record and referrals).

"This guy is THE leading visionary on reality.
He routinely discusses things which no one else has talked about, yet,
turn out to be quite relevant months later."
NOTE: contributions are acknowledged in the order received. Your name and email remain confidential and will not be given to any other individual, company or agency.
Thank you, Jennifer K. ($25), for your wondrously generous contribution
to this site. I am greatly honored by your support and readership.
Your readership is greatly appreciated with or without a donation. For more on this subject and a wide array of other topics, please visit my weblog. All content, HTML coding, format design, design elements and images copyright © 2008 Charles Hugh Smith, All rights reserved in all media, unless otherwise credited or noted. I would be honored if you linked this wEssay to your site, or printed a copy for your own use. |
| consulting | blog fiction/novels articles my hidden history books/films what's for dinner | home email me | ||