|
|

|
|||||||||||||
|
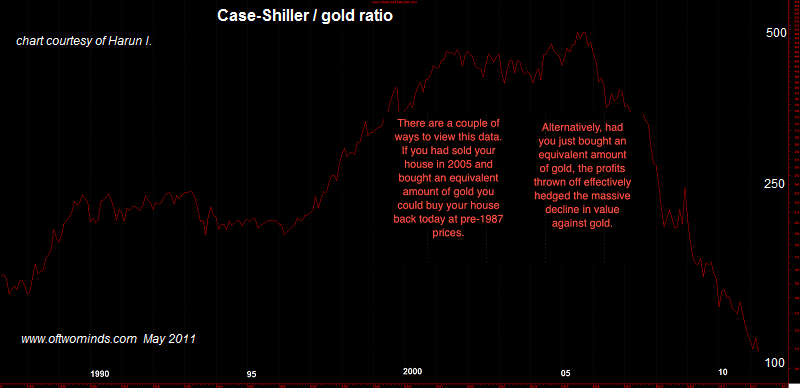
Priced in Gold, Is Housing a Buy? (May 20, 2011) What is the relative value of housing if we price it in ounces of gold? My basic point of view is that nominal prices and broad terms such as deflation, inflation and growth should be viewed with extreme skepticism. The more useful approach is to examine the purchasing power of various assets and the the purchasing power of the income streams generated by those assets. Put another way: to value housing, let's compare the price of a house priced in loaves of bread, or ounces of gold, or barrels of oil to historical norms. Secondly, let's look at the income stream generated by the median-priced home (that is, the median rent and net income after all expenses of maintaining and paying for the rental home are deducted) and ask how many loaves of bread, ounces of gold and barrels of oil that net income can buy. Corrospondent Bart D. has charted some relative values for essentials in Australia, and I will share his fascinating charts next week. Inspired by his work, I have done some calculations on U.S. prices of bread, housing, oil, etc. as well. Today let's look at a chart of the Case-Shiller Housing Index priced in gold, courtesy of longtime correspondent Harun I.
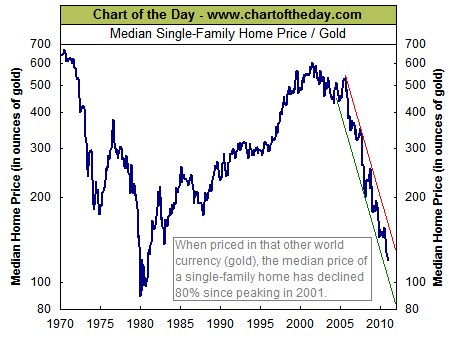
Harun's comments are worth studying. Selling housing at the top and buying gold would have enabled the speculator to buy back his/her house at 1985 valuations. Alternatively, an equal investment in gold in 2005 would have served as a hedge to the huge loss of housing value as the bubble popped. The Case-Shiller Index tracks the resale prices of homes, and is widely considered to be the most accurate metric of house prices. Median or average prices can be heavily skewed by a small number of outlier homes (very costly or very cheap), and they do not reflect the dynamics of the housing market as well as resale prices. In broad terms, the ratio of the Case-Shiller Index and gold can be understood as "housing priced in gold." We can see that the current ratio is around 110, which aligns almost perfectly with the second chart, which prices the median home in gold going back to 1970.
The calculation is easy: last report median home price of $166,000 divided by price of gold $1,500 per ounce = 110. On Harun's chart, we can see the ebb and flow of both housing and gold. A mini-bubble boosted housing prices dramatically in the late 1980s as the last of the Baby Boom bought homes. (The Baby Boom is typically considered the generation born between 1946 and 1964, but many dispute these dates.) Those born in 1960, for example, reached their peak home buying years of 25-30 in 1985-1990. Gold declined modestly in price in that era, so the ratio moved smartly as housing jumped. In the 1990s tech/dot-com stock bubble era, housing and gold were both flat, and this is reflected in the ratio's meandering through much of the 1990s. Gold slipped in the late 1990s and housing began a new ascent as the dot-com capital gains and low interest rates began to move real estate markets. As housing prices climbed from 1997 to 2001, gold went nowhere, so the ratio more than doubled. Put another way, housing greatly outperformed gold. As the dot-com bubble burst, housing increased its attractiveness as a speculation and gold began its ascent. As a result, the ratio stayed flat in 2001-2004 as both gold and housing rose together. The housing bubble's last sprint to the peak in 2006 puched the ratio up to 500: it took 500 ounces of gold in 2006 to "buy a share" of the Case-Shiller Housing Index. In terms of the median price, it took almost 600 ounces of gold to buy the median priced house in 2005. Then housing collapsed, and gold rocketed from $500/oz to $1,500/oz. As a result of housing declining by 40% and gold tripling, the ratio has plummeted by 80%, from 500 to just above 100. How low can the ratio go? Some might look at the second chart and conclude that the previous bottom around 90, in 1980 when gold shot up to $800/oz, might well mark a bottom in the ratio. Those who believe that 90 is the bottom would then sell their gold and buy housing at that point. Since the ratio is currently at 110, that point is still a ways off. I am not so sure, as there is plentiful evidence that we are entering an unprecedented era. The Baby Boom numbers about 65 million, and the generation behind them (Gen X) is considerably smaller (45 million). That suggests there won't be enough buyers to buy all the houses sold as Boomers downsize/retire. As the U.S. economy grinds toward its event horizon, the generations behind the Boomers are less wealthy--their wages have stagnated, and they will inherit less wealth as assets in general fail to keep pace with inflation (i.e. loss of purchasing power). If you examine the data in this list of median home prices, by state, in nominal and adjusted prices from the U.S. Census Bureau, you will note a gigantic jump in housing prices between 1970 and 1980. This coincides with the brutal inflation of that era and the first wave of Boomers buying homes. In broad brush, this data suggests that housing has retraced back to around 1990 valuations when priced in constant/adjusted dollars. Priced in gold, it has retraced to the early 1980s, but I think it likely that the generational retrace could eventually fall all the way back to 1970 prices in constant dollars. That suggests housing could fall quite a bit further in markets which retained the huge gains logged in the 1970-1980 period. Meanwhile, at least one respected analyst has set a target for gold of $5,200. Louise Yamada called the turn in gold in 2000-2001, and set a target of $1,500/oz years ago. Thus her technical targets should not be dismissed out of hand. Yamada has also called for a turn in interest rates/the bond market. The Federal Reserve has kept interest rates at historic lows for years, but cycles cannot be eliminated, they can only be extended. So once the 30-year cycle of falling rates reverses into an era of rising rates, housing will come under a pressure it hasn't experienced in two generations: price compression from rising mortgage rates. Simply put, the $300,000 home at 5% mortgage rates will decline to $150,000 if mortgage rates double to 10%. The average household can only afford so much per month for a mortgage. If rates double, then the sum of the mortgage has to fall by half to be affordable. Yes, there are cash buyers, but if central banks around the world have to stop printing trillions in free money to rein in rising inflation, then the flood of free cash looking for a quick return will dry up very quickly. We might also ask what happens to speculation in rising home prices if interest rates start rising. If cash buyers are counting on hefty returns from rental income, then we have to ask what might happen to rents. Even if housing stays at current prices, if gold triples to $4,500 an ounce, then the housing-gold ratio would fall to the 30s: $160,000 divided by $4,500 = 35. If housing declines another 25% to a median of $120,000, then it would take a mere 27 ounces of gold to buy a median-priced house. There are certainly good arguments (usually based on replacement costs) that housing can't possibly fall much lower, but oversupply and higher costs of money may well combine to push the speculative value of housing to new lows.
This is all speculation and guesswork, of course. All we can do is look at
trends and study history for clues about what might happen. What will happen is unknown.
Of Two Minds Kindle edition: Of Two Minds blog-Kindle

"This guy is THE leading visionary on reality.
He routinely discusses things which no one else has talked about, yet,
turn out to be quite relevant months later."
NOTE: contributions are acknowledged in the order received. Your name and email remain confidential and will not be given to any other individual, company or agency.
Or send him coins, stamps or quatloos via mail--please request P.O. Box address. Subscribers ($5/mo) and contributors of $50 or more this year will receive a weekly email of exclusive (though not necessarily coherent) musings and amusings, and an offer of a small token of my appreciation: a signed copy of a novel or Survival+ (either work admirably as doorstops). At readers' request, there is also a $10/month option. The "unsubscribe" link is for when you find the usual drivel here insufferable.
All content, HTML coding, format design, design elements and images copyright © 2011 Charles Hugh Smith, All rights reserved in all media, unless otherwise credited or noted. I would be honored if you linked this essay to your site, or printed a copy for your own use. |
Add oftwominds.com to your reader:
|
| Survival+ | blog fiction/novels articles my hidden history books/films what's for dinner | home email me | ||