|
|
|
It's Different This Time: Housing, Deflation and Depression (October 20, 2008) Now that the economy is careening from a systemic financial meltdown into depression, it is easy pundit pickings to "compare and contrast" this depression with the Great Depression of the 30s and with the Stagflation of the 70s. We've all seen a number of these analyses, and I have yet to find one which illuminates housing's quite different characteristics in the deflationary 30s, the inflationary 70s and the present. Here is my attempt to draw distinctions between those past depressions and the one we are now entering. Why single out housing? For the simple reason it is the primary reservoir of both psychological and "real" wealth (i.e. assets as measured in constant dollars or purchasing-power parity.) When housing plummets in real value, 2/3 of the nation (those who own homes) both feels poorer (the "reverse wealth effect") and is measurably poorer in terms of assets owned. Let's start by assessing "what's different" and "what's similar." 1. Home ownership in 1930s was about 45%; the majority of citizens were renters/tenants. After the war the advent of low-down, low-interest FHA and VA (Veterans Administration) affordable mortgages fueled a sharp rise in homeownership which raised the rate to 60% by the late 50s. At that point the rate plateau'd and slowly rose to 65% by the late 70s.
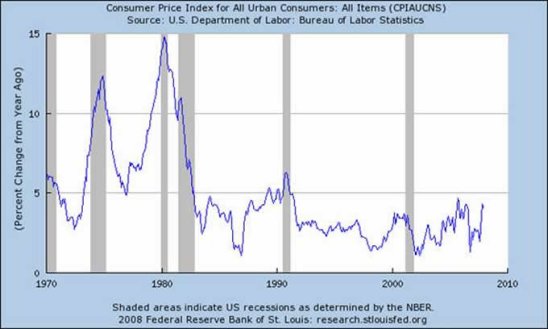
This tremendous rise in the "ownership society" reflected three postwar positives: booming economy which created millions of middle-class income jobs, cheap plentiful domestic oil and cheap, plentiful Federally backed mortgages. Basically, everyone who could afford a home was able to buy one. 2. Inflation and house prices rose in tandem in the staflationary 70s. Here we see just how steeply inflation ran up in the 70s:
Adjusted for inflation, the rise in housing was rather modest and well within historical norms, despite soaring nominal prices.
3. By two other measures of relative value--comparable rents and percentage of income--housing values remained relatively stable in the decades prior to the current bubble/bust. One standard way to measure housing prices is to compare them to the cost of renting comparable houses over time:
By this measure, we can see that houses did rise about 10% in the high-inflation late 70s, only to fall back 10% in the recessionary early 80s. The subsequent "mini-bubble" of housing values in the late 1980s registered less than a 10% rise, suggesting the increase was actually less than the bump up in the late 70s. Another valuable yardstick is to measure housing as a percentage of disposable income:
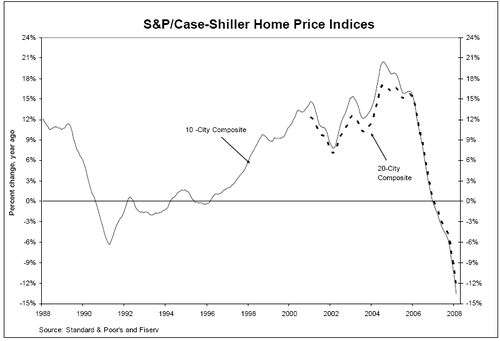
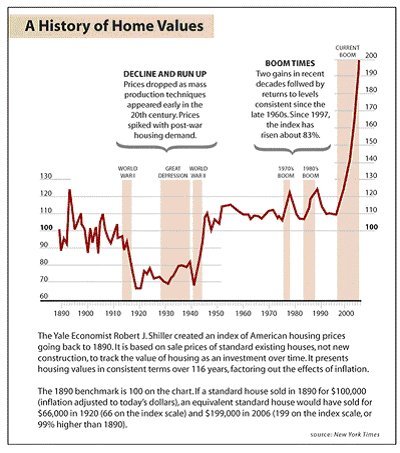
Here we see that in terms of income housing fluctuated within a modest band from 1955 to 1977. From about tne mid-70s, U.S. houshold income stagnated and as a result housing jumped as a percentage of income, breaking out of the historic range. The "mini-bubble" of the late 80s pushed housing up about 1/3 above historic norms. In the slowdown/recession of the early 1990s, housing as a percentage of income fell back to roughly the same level as 1980 as houses dropped in value and the tech boom of the 1990s modestly increased family incomes. This chart suggests that housing had leaped in relative value to a new range around 140, even as the cost-to-buy/rent ratio (chart above) returned to the 1975 range. 4. Around 2001, housing burst through all historic ranges of value and shot up in a parabolic/exponential ascent. The bubble is clearly visible in the two charts above as well as this one:
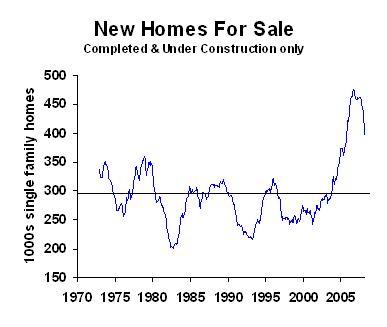
The extraordinary nature of this bubble is also revealed by charting New Homes For Sale:
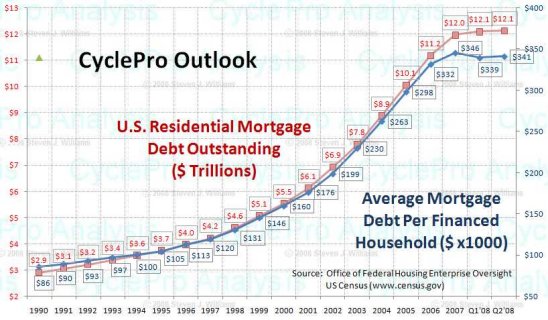
5. Beneath the surface of the credit/housing bubble, two disturbing trends were visible: a slow decline in savings and a stunning rise in mortgage debt. The charts tell the story:
Even as housing shot up in the late 1980s in a "mini-bubble," personal savings fell below its historic range and then plummeted from 8% of disposable income in the early 1990s to minus 1% at the peak of the housing bubble 2005-2007. Even as savings dropped to negative numbers, mortgage debt was quadrupling from 1990 to 2007:
The stock market's recent 40% has erased much of the equity gains of the 2002-07 period as well; combining the trillions in lost housing value with the trillions lost in global stock markets, we can see that most if not yet all of household wealth gain 2002-06 has been surrendered. Alas, parabolic bubbles eventually return to the mean via steep declines, as this chart illustrates:
So what can we conclude about the current depression and housing? 1. Ironically, the postwar rise in home ownership means the stunning decline in housing wealth affects 2/3 of all households rather than the 1930s-era 45%. 2. Rising housing values effectively masked the stagnation in household incomes for the past 25 years; now with housing returning to historic valuations, the stagnation of real income is starkly revealed.
3. Housing has a long way yet to fall to return to historic measures of valuation based on comparable rents and as a percentage of disposable income. 4. The main difference between past depressions and the current one is we are far more indebted now--both nominally and when adjusted for inflation. 5. Income stagnation is now coupled with asset deflation, effectively reducing household net worth. 6. The decline in housing value has effectively rendered housing a Capital Trap as "won't sell" becomes "can't sell":
The growing dependence of the U.S. household on rising housing values to offset declining income has now reversed into a debt serfdom in which any remaining capital/net worth left in housing is effectively trapped. All this suggests that calls for a "bottom in housing" in 2009 or even 2010 are optimistic. Bonus "it's a small world" story: I haven't mentioned that Obama and I graduated from the same private prep school in Honolulu. I don't think this alumni connection taints my analytic skepticism too greatly, but I do have a soft spot for Obama's Hawaii connections, which I believe are more profound than most Mainlanders can understand.
I recently discovered some of my old Lanai High School teammates scrimmaged
with Obama after-hours on the Punahou basketball courts; here is my report, graciously
posted on Ian Lind's widely read and highly respected Ka'a'awa-based blog
ilind.net--The Obama-Lanai Connection. Put this in the "Dis stay one small-kine
world" file....

"This guy is THE leading visionary on reality.
He routinely discusses things which no one else has talked about, yet,
turn out to be quite relevant months later."
NOTE: contributions are acknowledged in the order received. Your name and email remain confidential and will not be given to any other individual, company or agency.
Thank you, Eugenio M. ($15), for continuing generosity
to this site and for your many contributions of resources and topics.
I am greatly honored by your support and readership.
Your readership is greatly appreciated with or without a donation. For more on this subject and a wide array of other topics, please visit my weblog. All content, HTML coding, format design, design elements and images copyright © 2008 Charles Hugh Smith, All rights reserved in all media, unless otherwise credited or noted. I would be honored if you linked this wEssay to your site, or printed a copy for your own use. |
| consulting | blog fiction/novels articles my hidden history books/films what's for dinner | home email me | ||
 As an unprecedented credit bubble of low-interest liquidity fed a speculative fever
in all three asset classes, stocks, bonds and housing, household wealth shot up
$20 trillion from the 2002 stock market nadir to the housing-bubble peak in 2006.
As an unprecedented credit bubble of low-interest liquidity fed a speculative fever
in all three asset classes, stocks, bonds and housing, household wealth shot up
$20 trillion from the 2002 stock market nadir to the housing-bubble peak in 2006.