|
|

|
|||||||||
|
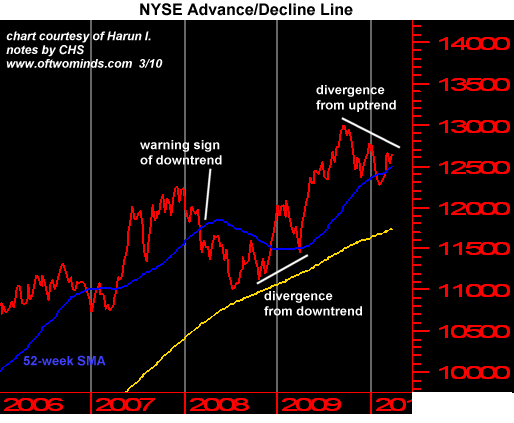
Updating the Stock market's Forgotten Indicators (March 25, 2010) Volume and advance/decline lines offer a window into stock market strength and weakness. Astute reader Deon N. recently suggested that an update of the stock market's "forgotten indicators" would be timely. Deon referenced a prescient entry from last February: Forgotten Indicators: Is the Stock Market About to Turn Up? (February 5, 2009) in which frequent contributor Harun I. provided a snapshot of the sock market through the lens of what he termed forgotten indicators: total volume and the advance/decline line. In response to Deon's request, Harun has kindly updated these "forgotten indicators." To smooth out noise, he has plotted long-term (52-week) moving averages on the charts. I have excerpted the recent history of these multi-decade charts for a closer look; click on the image to open a new browser window with the full chart. Here is the NYSE advance/decline chart, with a few notes from me:
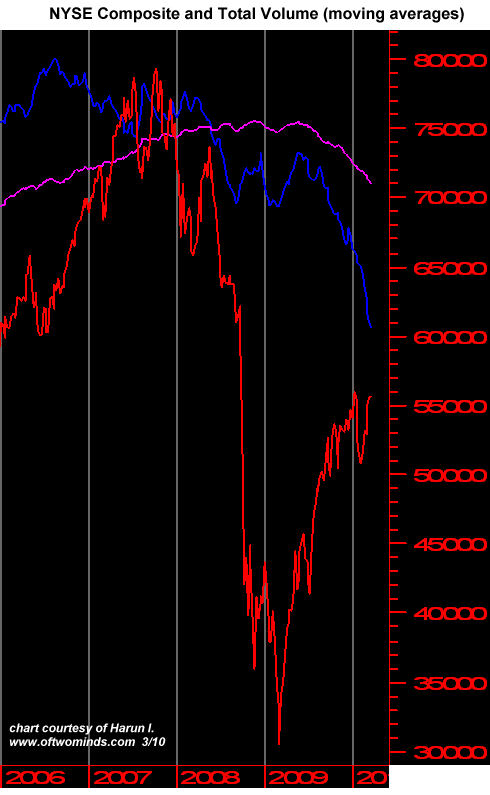
And here is the NYSE total volume chart:
Harun provided this detailed commentary on the charts:
This goes along the lines of "just when I thought no one was paying attention". Bravo Zulu to your reader. Thank you, Harun, for this update. My notes on the NYSE A/D line chart are self-explanatory. When price moved decisively below the advance/decline moving average in early 2008, that was an unmistakable warning sign of weakness to come--a full six months before the wealth destruction that occurred late in 2008. Yet even as the market plummeted in 2009, the A/D line was diverging by hitting higher highs and higher lows. This presaged the major rally that topped out (in terms of the A/D line) in September 2009. Now the A/D line is tracing out a divergence from this uptrend as it makes lower highs and lower lows. If the A/D line tends to signal a change of trend in price about six months ahead, then we are coming up on a price decline (9/09 + 6 months = 3/10). The Wall Street truism is that "volume is the weapon of the Bull." If so, the Bull has been stumbling since mid-2006. Note how the blue moving-average line of volume fell sharply in early 2008, presaging the price collapse to come, and how it rebounded in early 2009 as the market rallied from the March 2009 lows. Yet volume essentially collapsed in mid-2009, even as price continued its steady climb to recent highs. That divergence reveals fundamental distribution: players are selling madly as price moves up. The classic description of distribution is strong hands (insiders) are selling to weak hands (marks and shills who bought into the propaganda about the "strong recovery") who will be left as bagholders when price collapses.
As always please read the HUGE GIANT BIG FAT DISCLAIMER below to refresh your
understanding that this is not investment advice, it is simply the freely offered
ramblings of an amateur observer. By way of disclosure, I am short BAC and APC via
puts, short the SPX via an inverse exchange-traded fund and heavily in cash. I
could get creamed in these positions so please note once again that this is a
disclosure, not advice, and it is offered so you can assess if what I'm writing here
aligns at all with my own speculative positions.
DailyJava.net
is now open for aggregating our collective intelligence.
Of Two Minds is now available via Kindle:
Of Two Minds blog-Kindle

"This guy is THE leading visionary on reality.
He routinely discusses things which no one else has talked about, yet,
turn out to be quite relevant months later."
NOTE: contributions are acknowledged in the order received. Your name and email remain confidential and will not be given to any other individual, company or agency.
Or send him coins, stamps or quatloos via mail--please request P.O. Box address. Your readership is greatly appreciated with or without a donation.
For more on this subject and a wide array of other topics, please visit
my weblog.
All content, HTML coding, format design, design elements and images copyright © 2010 Charles Hugh Smith, All rights reserved in all media, unless otherwise credited or noted. I would be honored if you linked this wEssay to your site, or printed a copy for your own use. |
|
| consulting | blog fiction/novels articles my hidden history books/films what's for dinner | home email me | ||