|
|
|
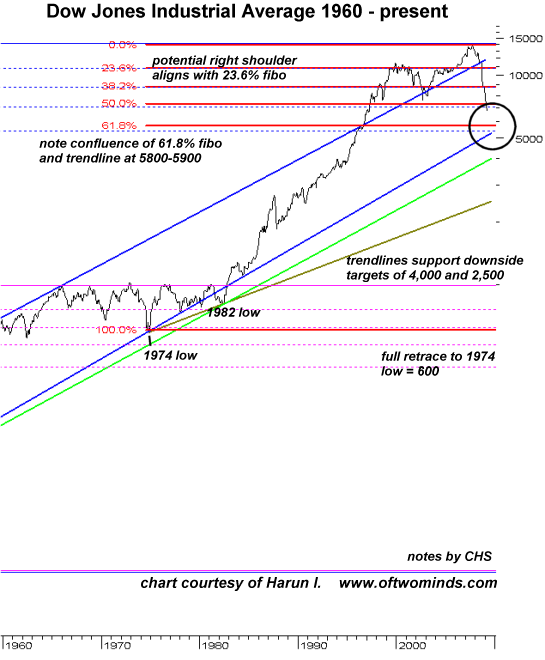
Trendlines in the Dow Jones Industrial Average (March 10, 2009) Trendlines can certainly be violated, but nonetheless they provide some historical context for the stock market and other data sets. The Dow Jones Industrial Average is approaching the lower trendline drawn from the 1932 Great Depression low. Frequent conributor Harun I. was kind enough to submit a chart of the Dow Jones Industrial Average (DJIA) from 1920 to the present with some trendlines and fibonacci projections. Trendlines vary, of course, depending on the timeframe and the points chosen (usually highs and lows). Here is a section of the full chart, formatted to fit this page, covering the period 1960-present. Just click on this chart to open the full 1920-2009 chart in a new browser window:
Several widely respected technical analysts have projected a near-term bottom just below the 6,000 level--interestingly, right at a confluence of a 61.8% fibonnaci projection and the lower trendline stretching back to 1932. Rick Ackerman at Rick's Picks recently projected a target of 5,794 for the DJIA, while Dow Theorist Enrico Orlandini identified a target of 5,890. Sometimes the market can overshoot a trendline and then rise back above it; other times, it can break through a trendline decisively. So I present this chart not a predictive tool but simply as a "what if?" illustration. There is no law which requires the market to reach any particular fibonacci projection, and as such we have to recognize the possibility that the market will foil technical expectations and reverse trend at, say, 6,300, for no reason other than "it's just time." We also have to note that as the Depression deepens, downside trendline targets include 4,000, 2,500 and even a full retrace to the 1974 lows around 600. Yikes. As noted here in the past, the DJIA has bottomed at a number equal to the dollar cost of an ounce of gold--around $800 at the 1982 low of about 800. How long might it take to reach 800? Perhaps many years--or perhaps it never drops below 4,000 as gold rises up to $4,000 per ounce. No one knows where the final Depression bottom will be, but it is likely some ways off. This chart provokes a line of absolutely contrarian speculation: (note that this is merely the freely offered rambling of an amateur; please read the HUGE GIANT BIG FAT DISCLAIMER below which states that this is not investment advice). Suppose the market has simply overshot the 50% fibonacci projection around 7,200. If this is the case, then it may not reach the 61.8% projection at 5,900 but instead rocket back up to form the right shoulder of a massive head-and-shoulders formation which began about 1996 at the 50% fibo projection just above 7,000. Were the DJIA to form such a right shoulder, we might expect it to reach all the way back up to about the 10,800 level--roughly the top reached by the left shoulder in January 2000. I know, I know, we're in a Depression and the economy is in a free-fall--it's insane to even speculate about a huge rally from 6,000 to nearly 11,000. Yes, it's insane but this is a contrarian site. As soon as The Wall Street Journal publishes articles saying the DJIA could drop to 5,000, Dow 5000? There's a Case for It, then I start thinking the market rarely rewards the consensus--Bull or Bear. The point to short the market was last August, when complacency reigned supreme. Now that fear and fatalism rule the roost, contrarians are wondering if the majority who now assume the worst are ripe for a trend reversal. If there is one--and if history is any guide, there will be, and perhaps very soon--then I predict few will believe it's a "real rally." Given the doomsday realities of the global economy, who would be dumb enough to believe that a rally could last more than a few days or maybe a few weeks? So as the market reaches back up to the 7,200-7,400 congestion area, most will expect it to decline as the flood of bad news continues. That skepticism creates the Bull's favorite exercise, "climbing the wall of worry." Am I suggesting we might see a new multi-year Bull Market? No; I am simply pointing out that the chart--fibos, trendlines and a potentially huge head-and-shoulders formation--does not preclude such a sharp bout of euphoria. Bears will be grinding their teeth down to the gumline, to be sure, if the market blows past 7,200 and never looks back until it hits 10,000. Consider how few analysts and pundits foresaw DJIA 6,500 last August; now consider that the same number--vanishingly small--might foresee what seems equally impossible now: a run straight back up to 10,800 to form a beautiful right shoulder in a massive multi-year head-and-shoulders formation. You heard it here first--insane, kooky, contrarian, yes, yes, oh yes. Here is a recent entry on the stock market:
Forgotten Indicators: Is the Stock Market About to Turn Up?
Chris Sullins' "Strategic Action Thriller" is fiction, and on occasion contains graphic combat scenes.

"This guy is THE leading visionary on reality.
He routinely discusses things which no one else has talked about, yet,
turn out to be quite relevant months later."
NOTE: contributions are acknowledged in the order received. Your name and email remain confidential and will not be given to any other individual, company or agency.
Or send him coins, stamps or quatloos via mail--please request P.O. Box address. Your readership is greatly appreciated with or without a donation.
For more on this subject and a wide array of other topics, please visit
my weblog.
All content, HTML coding, format design, design elements and images copyright © 2009 Charles Hugh Smith, All rights reserved in all media, unless otherwise credited or noted. I would be honored if you linked this wEssay to your site, or printed a copy for your own use. |
| consulting | blog fiction/novels articles my hidden history books/films what's for dinner | home email me | ||