
|
|
| articles | forbidden stories I-State Lines resources my hidden history reviews | home | ||

Writing/Film Dear Aspiring Writers: The Worst Advice You'll Ever Read A Literary Look at I-State Lines Spirited Away: Decay and Renewal An American Poem (Robinson Jeffers) Taoist Chinese Poems The Nelson Touch "It's all about oil, isn't it?" Kurosawa's High and Low A Bountiful Mutiny Howl's Moving Castle Thailand's Iron Ladies Trois Colours: Red The Thin Man: Thoroughly Modern Movies Why My Book Is Better Than the DaVinci Code Iranian Films: The Mirror Piratical Nonsense A Real Pirate Movie: Captain Blood 9 more in archive Recommended Books American Identity American Identity Literary Contest Winners, 2006 (fiction and essays) Hapas: The New America Can You Tell What I am? Part I Can You Tell What I am? Part II Only in America Self-Reliance Your Tattoo in 50 Years The American House and Frank Lloyd Wright Cultural Commentaries On Hatred and Anti-Americanism Anti-Americanism Part 2 Anti-Americanism Part 3 French-Bashing Germany: We All Have Problems, But... Kroika! Chronicles This Blog Sells Out Doom and Gloom Sells The Kroika Mascot-"Auspicious Pet" Wal-Mart and Kroika Kroika and Starsbuck Take a Hit Kroika Ad 1 Kroika Ad 2 Kroika Ad 3 Kroika Ad 4 Kroika Makes Bid for Oreo (April 1) Unfolding Crises: Asia China: An Interim Report Shanghai Postcard 2004 Corruption and Avian Flu: China's Dynamic Duo Exporting the Real Estate Bubble to China Is the Bloom Off the China Rose? China Irony: Steel, Marx & Capital Curing The U.S. and China's Dysfunctional Relationship China and U.S. Inflation Trade with China: Making Out Like a Bandit Whither China? Will the Housing Bust Take Down China? China's Dependence on Exports to U.S.; Is China About to Pop? 8 more Battle for the Soul of America Katrina, Vietnam, Iraq: National Purpose, National Sacrifice Is This a Nation at War? A Nation in Denial Why Is This Such a Tepid Time? That Price Isn't Cheap, It's Subsidized The Most Hated Company in America U.S. Fascists Seek Ban on Cancer Vaccine The Truth About Christmas American Dream or American Nightmare? 2006 Sea Change Obesity and Debt Immigration Ironies U.S. Healthcare: Working Toward a Real Solution A Drug Industry Running Amok Where There Is Ruin 10 more Financial Meltdown Watch What This Country Needs Is a... Good Recession Are We Entering the Next Age of Turmoil? Why Inflation Appears Low Doubling Down on 5-Card No-See-Um A Rickety Global House of Cards Are Japan and Germany Truly on the Mend? Unprecedented Risk 2 Could One Rogue Trader Bring Down the Market? Worried about Inflation? Stop Measuring It Economy Great? Bah, Humbug Huge Deficits and Huge Profits: Coincidence? Who's The Largest Exporter? Three Snapshots of the U.S. Economy Loaded for Bear Comparing Nasdaq to Depression-Era Dow Who's Buying Treasury Bonds? And Why? Derivatives: Wall Street Fiddles, Rome Smolders Financial Chickens Coming Home to Roost Is the Stock Market on the Same Planet as the Economy? The Housing-Recession-Oil-Healthcare Connection Could We Have Deflation and Inflation At the Same Time? What We Know, What We Can Safely Predict Bankruptcy U.S.A.: Medicare, Greed and Collapse Sucker's Rally A Whiff of Apocalypse Where There Is Ruin II: Social Security 31 more Planetary Meltdown Watch The Immensity of Global Warming Sun Sets on Skeptics of Global Warming Housing Bubble Watch Charting Unaffordability A Monster of a Housing Bubble A Coup de Grace to the Economy Hidden Costs of the Housing Bubble Housing Bubble? What Bubble? Housing Bubble II Housing Bubble III: Pop! Housing Market Slips Toward Cliff Housing Market Demographics Housing: Catching the Falling Knife Five Stages of the Housing Bubble Derailing the Property Tax Gravy Train Bubbling Property Taxes Have You Checked Your Property Taxes Recently? Housing Bubble: Where's the Bottom? Housing Bubble: Bottom II The Housing - Inflation Connection The Coming Foreclosure Nightmare 1 How Many Foreclosures Will Hit the Market? Housing Wealth Effect Shifts Into Reverse Housing Bubble Bust Will Take Down the Global Economy The New Road to Serfdom: A Negative-Equity Mortgage The Housing-Savings-Recession Connection After the Bubble: How Low Will It Go? After the Bubble: Rents and Housing Values Why Post-Bubble Rents Matter After the Bubble: How Low Will We Go, Part II Housing: 10% Decline May Trigger Financial Ruin How to Buy a $450K Home for $750K Inflation and Housing: Calculating the Bust The Growing Financial Risks of the Housing Bubble Construction Defects: The Flood to Come? Construction Defects Part II Who Gets Hammered in the 2007 Housing Bust Real Estate Bust: The Exhaustion of Debt What Happens When Housing Employment Plummets? One More Hole in the Housing Bubble: Insurance Financial Kryptonite in a "Super-Strength" Housing Market Three Secrets to Unloading Property Today Welcome to Fantasyland: Housing's "Soft Landing" Why Is the Median House Price Still Rising? Why Median Prices Appear to be Rising? The Root Cause of the Housing Bubble Housing Dominoes Fall Twilight for Exurbia? Phase Transitions, Symmetry and Post-Bubble Declines 10 more Oil/Energy Crises Whither Oil? How much Is a Gallon of Gas Worth? The End of Cheap Oil Natural Gas, Naturally High Arab Oil Money and U.S. Treasuries: Quid Pro Quo? The C.I.A., Oil and the Wisdom of Crowds The Flutter of a Butterfly's Wings? A One-Two Punch to a Glass Jaw Running Out Of Oil vs. Running Out of Cheap Oil 2 more Outside the Box How to Make a Favicon Asian Emoticons In Memoriam: Winky Cosmos The Wheeled Vagabonds Geezer Rock Overload Paying for Web Content In a Humorous Vein If Only Writers Had Uniforms Opening the Kimono Happiness for Sale: Jank Coffee Ten Guaranteed Predictions for 2010 Why My Book Is Better Than the DaVinci Code My Brand Management Stinks Design Follies The New Jank Coffee Shop Jank Coffee, Upscale Tropic Style One-Word Titles Complacency Nostalgia Lifespans Praxis Keys to Affordable Housing U.S. Conservation & China Steve Toma, Me & Skil 77s: 30 years of Labor Real Science in the Bolivian Forest Deforestation and Sustainable Forestry The Solar Economy (book) The Problem with Techno-Fixes I Love Technology, I Hate Technology How To Blow off Web Ads and More 2 more Health, Wealth & Demographics Beauty of the Augmented (Korean) Kind Demographics and War The Healthiest Cold Cereal: Surprise! 900 Miles to the Gallon Are Our Cities Making Us Fat? One Serving of Deception Is Obesity an Inflammatory Response? Demographics & National Bankruptcy The Decline of Europe: A Demographic Done Deal? Are the Risks of Obesity Overstated? Healthcare: Unaffordable Everywhere Medication Nation The New Disease We Just Know You've Got Can You Can Tell Which Pill Is Fake? Bankruptcy U.S.A.: Medicare, Greed and Collapse The 10 Secrets to Permanent Weight Loss 5 more Landscapes Selling the Landscape The Downside of Density Building Heights and Arboral Roots Terroir: France & California L.A.: It's About Cheap Oil The Last Redwood Airport Walkabouts Waimea Canyon, Yosemite, Camping & Pancakes Nourishment The French Village Bakery Ideas What Is Happiness? Our Education System: a Factory Metaphor? Understanding Globalization: Braudel Can You Create Creativity? Do Average People Know More Than Their Leaders? On The Impermanence of Work Flattening the Knowledge Curve: The "Googling" Effect Human Bandwidth and Knowledge Iraqi Guangxi Splogs, Blogs and "News" "There is no alternative to being yourself" Is There a Cycle to War? Leisure, Time and Valentines Is the Web a Giant Copy Machine? Science Matters Anti-Missile Defense: Boost Phase Vulnerability History The Strolling Bones: Rock of Ages Bad Karma: Election Fraud 1960 Hiroshima: First Use All the Tea in China, All the Ginseng in America Friday Quiz Pet Obesity The Origins of Carbonara Organic Farms Oil and Renewable Energy Human Diseases Wine and Alzheimers Biggest Consumers of Chocolate 7 more Essential Books The Misbehavior of Markets Boiling Point (Global Warming) Our Stolen Future: How We Are Threatening Our Fertility, Intelligence and Survival How We Know What Isn't So Fewer: How the New Demography of Depopulation Will Shape Our Future The Coming Generational Storm: What You Need to Know about America's Economic Future The Third Chimpanzee: The Evolution and Future of the Human Animal The Future of Life Beyond Oil: The View from Hubbert's Peak The Party's Over: Oil, War and the Fate of Industrial Societies The Solar Economy: Renewable Energy for a Sustainable Global Future The Dollar Crisis: Causes, Consequences, Cures Running On Empty: How The Democratic and Republican Parties Are Bankrupting Our Future and What Americans Can Do About It Feeling Good: The New Mood Therapy Revised and Updated Recommended Books More book reviews Archives: weblog August 2006 weblog July 2006 weblog June 2006 weblog May 2006 weblog April 2006 weblog March 2006 weblog February 2006 weblog January 2006 weblog December 2005 weblog November 2005 weblog October 2005 weblog September 2005 weblog August 2005 weblog July 2005 weblog June 2005 weblog May 2005 What's New, 2/03 - 5/05 |
 |
October 31, 2006 A Halloween Scary Story...with Zombies... What We Can Learn from Japan's 15-Year Decline in Real Estate Frequent contributor Michael Goodfellow suggested I provide some data about Japan's real estate bubble and bust--and just in time for Holloween, here we have some truly frightening charts: 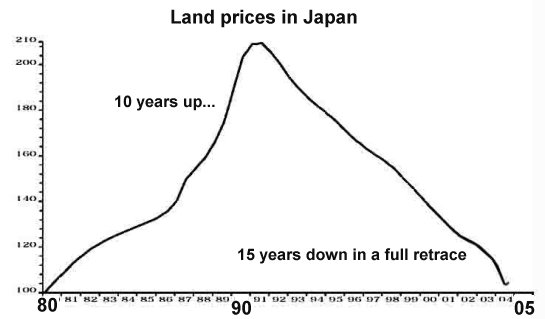
Here we see that Japan experienced a full retrace to the pre-bubble value of real estate. This is typical of valuation bubbles. If the U.S. housing bubble follows this pattern (and why should it deviate from a pattern which has held for hundreds of years, going back to the Tulip Craze in Holland?), then the house that sold for $150,000 in the S.F. Bay Area in 1995 and went for $600,000 in 2005 will eventually retrace to being worth $150,000. 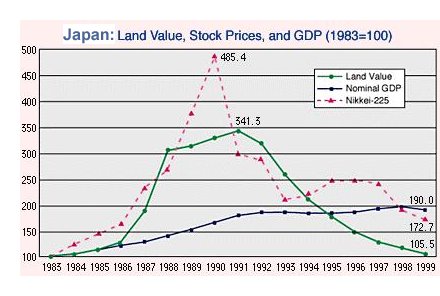
Just for context, here is a chart which shows that the export-dependent Japanese economy actually rose even as the stock and real estate markets were plummeting. To hope that the import-dependent U.S. economy will fare as well would at first glance appear unlikely. Note that that the stock market bubble topped before the real estate bubble, but both tanked, slowly and painfully, for a decade or more. (Note that while the two charts show somewhat different timeframes for the re-trace, the end result is the same.) Here we have a summary from Wikipedia on the Japanese real estate bubble and its aftermath: Prices were highest in Tokyo's Ginza district in 1989, with some fetching over US$1.5 million per square meter ($139,000 per square foot), and only slightly less in other areas of Tokyo. By 2004, prime "A" property in Tokyo's financial districts were less than 1/100th of their peak, and Tokyo's residential homes were 1/10th of their peak, but still managed to be listed as the most expensive real estate in the world. Some US$20 trillion (1999 dollars) was wiped out with the combined collapse of the real estate market and the Tokyo stock market.The key take-away from the charts and summary is this: the Japanese bubble was not in housing, it was in lending. The same is true of the U.S. bubble which is just beginning its deflation. If all mortgages had continued to require 20% down in cash and well-documented sources of income, the bubble would have run out of buyers long ago. How long will it take for the U.S. property bubble to fully deflate? Good question. Japan's property values outside Tokyo and a few other major cities continue to decline fully 15 years after the bubble top. Will the U.S. also suffer a 15-year decline? The answer is less financial than political; Japan's Diet (Federal Legislature) is heavily slanted toward sparsely populated rural districts, and the intertwined nature of business and government is quite different from the U.S. These and other factors (such as the great power of the government financial bureaucracies and the cultural disinclination to mar a facade of normalcy) hindered Japan's ability to grapple honestly with the vast deflation of property and equity assets which left their financial system crippled with non-performing, never-to-be-repaid loans. 
Hopefully, the U.S. citizenry will refuse to let the powers that be stand aside and watch numbly as the bubble deflates. If some action akin to the cleanup of the Savings and Loan fiasco of the early 90s (another mess needlessly brought on by no oversight and loose lending standards) were instigated, perhaps the U.S. decline could be shortened to a mere six years or so from Japan's 15-year "Lost Decade." If, however, the government agencies responsible for overseeing financial institutions and lenders allow the lenders to try to re-inflate the bubble via "zombie" loans to "zombie" borrowers, then the pain will only be lengthened and exacerbated--as Japan has so ably shown. As the chart above reveals, government bail-outs have created such a massive public debt that fully 70% of Japan's tax revenues are devoted to paying interest on the public debt. If that doesn't frighten you, then you may already be a zombie. But all that remains to be seen, for the hard years are still ahead. October 30, 2006 Welcome back, Readers! Housing's Stairstep Descent: the "39 Steps" Last time we looked at housing's "Plateau of Denial"; today we look at the "39 steps" of its protracted, painful stairstep descent. I am, of course, referring to Alfred Hitchcock's delightful 1935 suspense/romance/espionage film classic, The 39 Steps Sounds like an excellent description of the real estate market. The market might well end up tracing far fewer than 39 such stairsteps down to its ultimate low in 2011 or 2012, but in the spirit of innocents plunged into financially deadly troubles and smooth sharpies playing hidden hands to the detriment of said innocents, here is an informal chart of the steps the housing market has already begun descending: 
Lest you imagine that I have made up the first stair down, please read Auctions' appeal grows with builders' inventory (Oct. 27, 2006) in the Los Angeles Times: For developers, getting saddled with unsold units drags down the bottom line. So selling off a slew of units at once makes sense, even if it cuts profit margins in the short term.Alas, over-anxious 24 year-olds are being suckered into paying a mere 15% profit to the condo developers rather than the 30% profits they commanded a year ago at the peak. For 24 year-olds, of course, memory holds nothing but a roaring housing boom; sadly, the idea of a 40% decline in valuations simply does not register as a possibility. Thus is Step 1 defined: over-anxious bottom-fishers jump in at the first hint of decline, confident that the roaring boom will soon re-appear. They have more chance of catching "The Great Pumpkin" on October 31. (with a tip of the hat to the "Peanuts" comic strip.) The next steps are already visible: a tightening of lending standards which will ultimately choke off the easy lending which fueled the boom. The answer, we're assured, is that the Fed will lower interest rates, re-igniting the blood lust for real estate. But Japan offers an interesting object lesson in this regard. Low interest rates do not necessarily translate into new loans being made. At the height of Japan's property bubble, when downtown Tokyo was worth more than all the real estate in the entire U.S., banks were literally begging customers to borrow another couple million dollars--for any purpose. After the bubble popped, Japan's central bank lowered interest rates to effectively zero, where they remain today, 15 years (and many tears) later--but the recovery in real estate in tepid and confined to central Tokyo. 
Why? Because banks were no longer able to lend money to poor risks, regardless of the low interest rate. As banks get stuck with non-performing loans, their losses mount, meaning that they have to raise cash to maintain even a mere 2% cash reserve against losses. (The current requirement for U.S. lenders is a paltry 1%--a number which is sure to rise.) As losses spiral out of control, their need for cash spirals up in tandem. The more foreclosed real estate they auction off to raise cash, the more they lose on their books as the foreclosed properties are sold for less than the mortgages. Japanese banks tried to cover up the fiasco by granting new loans so the bankrupt borrowers could make "interest payments" with freshly borrowed funds. But this legerdemain just increased their future losses, as the bankrupt borrower paid no actual interest on either the new or existing loans. 
We are already hearing of the same sort of obfuscatory practises being played in the U.S. as lenders desperate to keep non-performing loans off their books extend new credit to risky/bankrupt borrowers. When this house of credit cards collapses, as it surely will, the losses to lenders will preclude any future lending, no matter how low the Fed sets rates. And as I never tire of reminding readers, the Fed does not set long-bond or mortgage rates--the market does. And as risk rears its ugly head in the mortgage market, buyers of housing mortgages will begin demanding a risk premium--otherwise known as higher rates. This is why the stairstep leads down regardless of Fed policy or pronouncements. The train has already left the station, folks, and the Fed can wave its "magic interest rate wand" all it wants, but the train isn't coming back. NOTE: A big "mahalo plenty" (thank you) to the generous, brave and loyal (and possibly foolhardy) readers who ordered copies of my novel in my absence. I am also grateful to the International readers of this humble site, who (according to my server logs) hail from 88 nations on our little planet. Thank you, visitors from all nations, for your readership. October 23, 2006 The Housing Market - Plateau of Denial I have drawn a chart of the current housing market, showing both the current "Plateau of Denial" (prices remaining stubbornly lofty) even as inventory and foreclosures are rising. Please note the "Cross of Doom" which looms just ahead. 
What this chart depicts is a denial of the laws of supply and demand. Even as housing starts continue at a strong clip (1.8 million units a year), inventories have already reached historic highs (4 million units for sale). Add the rapidly increasing number of foreclosures and REOs ("real estate owned," a nice way of saying the lender now owns the property and is increasingly desperate to unload it) to the supply and you can predict a breakdown of the Plateau of Denial: a point at which sales prices drop sharply in the face of a vast and fast-rising inventory of unsold homes. All these trends have been visible since prices and sales topped out in Q2 2005--over a year ago. Yet prices--at least reported prices--have barely budged in many markets. Those of you familar with stock market technical analysis know of the "Cross of Death"; that's when a stock's 50-day moving average cuts through the 200-day moving average like a hot knife through butter. That marks an undeniable downtrend. Here on my chart, the "Cross of Doom" is marked by plummeting sales meeting sharply rising trendlines of foreclosures. Why is this the "Cross of Doom"? Because when demand crashes--as it inevitably does in eras of oversupply and dropping prices--even as inventory/supply is dramatically increasing, there is simply no way to balance the two forces. There is not enough demand to absorb the flood of supply which is swamping the market. The analogy is a dot-com stock circa late 2000. The supply of stock available for purchase was rising incredibly fast as people tried to exit the market, at the same time that the demand to purchase shares from hopeful/confident investors/speculators took a permanent nosedive in the face of plummeting prices. This is the same mechanism which took dot-com stocks from $348 per share at the peak to 56 cents per share at the bottom. I have also noted the inevitable "false bottom" in which prices temporarily stabilize as overzealous bargain-hunters declare the "bottom" in the housing market and rush in to snap up "bargains." This is akin to buying that dot-com stock for $190. Hey, it's way down from $348--now is the time to buy! It's cheap! Alas, $190 was merely a brief way station on the downslope to 56 cents. I anticipate the feverish cries of the housing bulls, shouting about the intrinsic value of a roof over your head, the rise in U.S. population, "you can always rent it," etc. But oversupply also means an oversupply of rental units, at least in areas of overbuilding, so the rental value of millions of empty units is effectively zero. Let me put this delicately: there is no such thing as intrinsic value. There is only the market price. If there is no demand and a massive oversupply, prices drop to levels which once seemed truly impossible. Eventually the stupendous imbalance between supply and demand is righted, but that process tends to take years in the real estate market. As for population growth, please note just how flexible human beings can be when it comes to dwellings. The San Francisco Bay Area gained hundreds of thousands of new residents during the dot-com heyday of the mid-90s to 2000, and yet 200,000 new units were not built in that time frame. In fact, only a few thousand new units were added to the housing stock of San Jose and San Francisco in those heady years. After dot-com turned to dot-bomb, over 250,000 jobs were lost, and a mass exodus of approximately 200,000 people left the Bay Area. The population actually dropped (check the U.S. Census numbers if you want.) Yet were 100,000 units suddenly vacant? No. People had taken roommates, or rented a room in a house, or doubled up with friends. The point being: enormous numbers of people can move in or out of existing cities with virtually no change in the number of dwellings. Therefore: people won't necessarily fill a million empty houses unless the cost is dramatically cheaper than their current rent. And it is a zero-sum game; if they do move, they would just create a million new vacancies in existing units--or perhaps 1.2 million. And what will the owners of those vacated units do? Drop the price below the competition, unless they want to sit on vacant units. We keep reading about rising rents in Manhattan and San Francisco. Fine--there is still a shortage of available units in those small, hard-to-add-units spots with strong job markets and desirable amenities. But the overbuilding didn't occur in Manhattan or San Francisco; the imbalances lie elsewhere, and that's where the pain will be felt first. So what's the value of a home? Try 10 times annual rent. That's the value as a business which has to make a profit. (Ten times zero is zero.) Disagree? Well, enjoy your stay on the Plateau of Denial, but watch the edge. It may be closer than you think. Note: I will be away from my desk this week. If you haven't checked my archives recently, you might be surprised by the diverse array of topics covered: "one-word titles," "Unfolding Crises: Asia," "Nourishment," Landscapes," "Outside the Box,"Praxis," and of course, "Housing Bubble Watch," just to mention a few. So please enjoy, and check back in next weekend. As always--thank you for your readership. If you want to read something completely different, why not buy a copy of my novel I-State Lines October 21, 2006 The "Record" Dow Jones Industrials--A Clear-Eyed Look The DJIA--Dow Jones Industrial Average--has just hit a new record. Of its 30 constituent companies representing diverse range of industries, how many do you reckon are hitting new highs? 28? Nope. 23? Not even close. 15? Try 7. Frequent contributor Harun I. recently alerted me to the extremely narrow breadth of this great Dow advance--only 7 of the Dow 30 stocks have reached new highs. This is troubling for anyone with a grasp of stock market history. The great Nasdaq Tech bubble of 1998-2000 was also extremely narrowly based, drawing the vast majority of its stratospheric rise from only 36 large-cap stocks such as Microsoft and Cisco Systems. Common sense, as well as stock market history, suggests any index advance which is based solely on a handful of companies is extremely vulnerable to collapse--which is just what happened as the Nasdaq fell from over 5,000 to 1,100 in less than three years. Even as the Nasdaq reached new heights, hundreds of companies within the index languished near their lows. Analysts who pointed this out were deemed Cassandras and widely mocked for not getting it, "because this time it's different." And here we go again, with an index hitting new highs based on only 22% of its constituent stocks. Harun also pointed out that according to classic Dow Theory, the Transport Index must also hit new highs to confirm the sustainability of the Dow advance. Alas, the transports are not hitting new highs--a red flag to adherents of Dow Theory. Here are eight Dow component charts, drawn from a number of industries. (Harun very generously assembled charts of all 30 DJIA stocks into a PDF which you can view by clicking here or download by right-clicking the link.) Take a quick look and see if you notice anything about these eight stocks: 
Do you see how far below their highs these stocks are? Do you note the number of giant, multi-year wedges in these charts? That should be very perturbing to anyone bullish on the Dow and indeed the U.S. economy. As I have pointed out here many times, wedges tend to break way up or way down--usually down. To be bullish on the Dow, you would have to believe that every one of these companies is poised for blow-out growth in sales and profits, enough to drive their stock prices upwards toward their previous highs. As noted here before, corporate profits are already at multi-decade highs, so to expect these companies to break out of multi-year wedges is asking quite a lot. A more clear-eyed view is that these charts reveal a Dow on the precipice of a massive breakdown. If, as many expect, the economy slips into a recession triggered by the downturn in housing, then it would only be rational to expect these stocks to break down rather than up. The narrow breadth of the new index highs and the large number of stocks on the verge of breaking down should give investors pause. The cheerleaders like to shout, "Go team, go, yea, new Dow record!" but do they ask you to look at the charts? No, because those are sobering, if not outright frightening. October 20, 2006 The Hawaii Earthquake--A Big Island Report 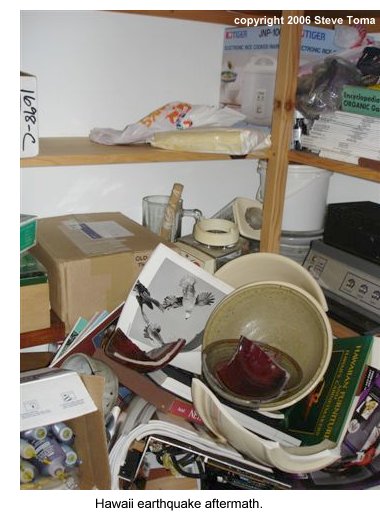 Those of you who've scanned the "my hidden history" page (link at top of page)
know I have spent about half my adult life in Hawaii, and maintain close ties
via numerous visits to family and friends.
Those of you who've scanned the "my hidden history" page (link at top of page)
know I have spent about half my adult life in Hawaii, and maintain close ties
via numerous visits to family and friends.
As a result, the earthquake beneath Kiholo, Hawaii on Sunday, October 15 was a worrisome event. Fortunately, no one in the islands lost their life, and losses were fairly modest compared to the fires, collapsed freeways and loss of life which resulted from the similar-sized Loma Prieta earthquake (6.7 on the Richter scale) which ocurred October 17, 1989 in the San Francisco Bay Area. (The epicenter was located in the Santa Cruz mountains.) That is not to say, however, that the Big island quake wasn't powerful or frightening. It was both, as this eye-witness email--written shortly after the quake--from our good friend Steve Toma in Kalopa, Hawaii, attests. (Kalopa, near the Hamakua coast town of Honoka'a, is about 40 miles from the epicenter.) It was one of the scariest things we've ever experienced! I never ever thought we'd have a quake like that here. If it had gone on much longer, I'm sure our house would have started coming apart, I'm getting goosebumps just writing about it now. Our structure is basically sound, the whole house shifted an inch or two judging from the bent pier straps, but brother, the entire contents of our house, office, studio and shop are totally strewn everywhere, it's a shambles. It really is like a giant picked up our house and shook the crap out it for what seemed to me in hindsight like 30 seconds, my neighbor said it felt like a minute but I don't think so. We just stood in the living room hanging on to each other watching everything crashing down, range moved about 18", woodstove almost off the mantle, chimney and stovepipe crashing down, it was horrific! We've been cleaning all day and the place still looks like a disaster area. Still feeling aftershocks and it's spooky.As an example of the peculiar things which occur in a powerful earthquake, take a look at Steve and Clara's sewing machine, which is stored in a cabinet with a door (visible on the left). The sewing machine bounced around and somehow ended up resting on top of two toppled spools of thread. Earthquake stories abound with tales of fragile objects miraculously saved from certain destruction, but also plenty of tales of fragile objects destroyed. 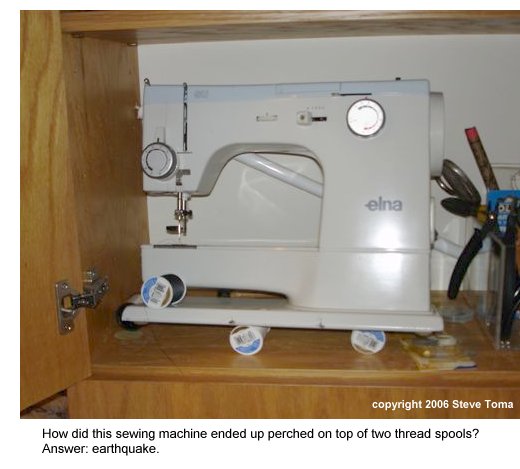
October 19, 2006 Big Lies, Small Lies and Felony Lies: Welcome to Real Estate 2006  Deceptive lending, deceptive listings, deceptive borrowers, deceptive buyers,
deceptive sellers--has there ever been an industry more rife with corruption and lies than
the current real estate market? Really? Where?
Deceptive lending, deceptive listings, deceptive borrowers, deceptive buyers,
deceptive sellers--has there ever been an industry more rife with corruption and lies than
the current real estate market? Really? Where?
As astonishing as the endless layers of lies is the complacency and droll acceptance of the deceit which reigns supreme in the real estate and mortgage industries. "Business as usual," now that "the market is returning to normal." Is business based on deception "normal" now? Here are the lies, big and small. Whether they are Felony lies--well, we'll just have to wait for the collapse to reach epic proportions. Then the public will demand some fall guys, and prosecutors will undoubtedly have many opportunities to pursue those who practised the many flavors of fraud and deceit which underpin this "boom." 1. Borrowing and lending (mortgages) based on lies, obfuscation and deceit 2. Re-listing houses to hide their time on market and original listing price 3. Demanding cash back from sellers, obscuring the actual selling price 4. Providing "incentives" to buyers which obscure the actual selling price Let's start with a look at the wide-spread practise of offering buyers incentives, allowing the builder or seller to propagate a false selling price, i.e. "sold at the listing price:" The Government Accountability Office told Congress last month that from 2003 to 2005, nontraditional mortgages rose from less than 10 percent of all mortgages to about 30 percent: Inflated prices potentially cause harm to banks, which could take a hit if the mortgage holder defaults and the home turns out to be worth less. It also could affect buyers of neighboring homes, who may be making decisions based on faulty data.Next up: the practise of buyers getting cash back from sellers, another way of boosting the actual selling price by tens of thousands of dollars: Some Cash-Back Home Deals May Be Illegal-- Illegal Off-The-Books Cash Back Incentives Put Lenders, Brokers and Buyers at Risk (yahoo.com) 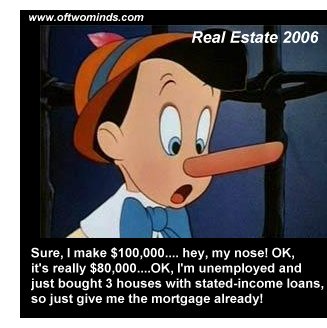 As for deceptive borrowing and lending, consider that 80% of subprime borrowers from one
California lender lied about their income. The lender, in turn, saddled them with deceptive
option-ARM loans which will re-set to rates and payments beyond the borrowers' means. Why?
Hey, you don't make money if you don't close the loan. Once it's closed, it's sold off
in a tranched mortgage-backed security to Wall Street. Who cares what happens after that?
As for deceptive borrowing and lending, consider that 80% of subprime borrowers from one
California lender lied about their income. The lender, in turn, saddled them with deceptive
option-ARM loans which will re-set to rates and payments beyond the borrowers' means. Why?
Hey, you don't make money if you don't close the loan. Once it's closed, it's sold off
in a tranched mortgage-backed security to Wall Street. Who cares what happens after that?
From Forbes.com, October 13: Laperriere points out that 79% of FirstFed Financial (nyse: FED) loans in the first half of the year were stated-income loans, according to its latest 10-Q. Almost one-fifth of Washington Mutual's (nyse: WM) loans during the same period were option-ARMs. And at Countrywide Financial (nyse: CFC), 42% of its giant mortgage portfolio consists of option-ARMs.And from the New York Sun, evidence that the borrowing boom is national and unprecedented in scale-- and unsustainable: As an example, 62% of non-agency loans made last year had low or no income verification, up from 24% in 1998. Also,52% of such loans made in 2005 had zero or negative amortization requirements. In 1998 there were no such loans.Last but certainly not least, let's look at the mechanics of re-listing homes to mask the length it's been sitting dead on the market, and how much the price has dropped from it's original number: Re-Listing Deception: 29255 Kuhn Lane, Mechanicsville, Md 20659What would the consequences be if this deception were not allowed? Reader "Financial Expert" sent in this link to an article by a California real estate broker who describes how re-listings make a hash of real estate data. The essay concludes with a warning about what would happen should listings actually reflect their original listing data and history of price reductions: The reason I am spending so much time on this and making an effort to bring home the point is that if we are not aware of this and prepare for it, the analysts are going to have everyone believing we are on the edge of a catastrophe and the belief that they are right will bring about the catastrophe they predict.When did facts and reality get such a horrible, terrible reputation? When they threaten the housing "boom," that's when. One thing the housing industry should note: people can be conned, but reality cannot. Reality eventually trumps deceit and lies. October 18, 2006 The Housing "Bottom" Is Now--Or Not Various pundits such as entertainer Jim Cramer (you know, the "screaming head") have called the bottom in housing stocks. To see if they're right, let's ignore their rantings and look at some charts. 
Although this chart is mine, frequent contributor Harun I. sent me a comment which explains the action in this chart very succinctly: The housing index hit its 50% retracement level. At this level a bounce is expected but does not declare the bottom.Briefly, here's what's going on in the housing index. Technical analysts have long noted that stocks tend to go up or down in stairstep-like patterns, and that these stairsteps often align with a Fibonacci series of numbers: .38, .50, .62, 1.0, 1.38, and so on. Interestingly enough, the HGX is following an A-B-C-D pattern down and hitting Fibonacci retracement numbers. The analysis works like this: the move from 100 to the top at 280 is 180 points. A 50% retracement would be a drop of 90 points to 190, which is right where the index bounced. The bounce target is 224, which is a 38% retrace of the 90-point move down. Interestingly, the HGX hit 221 before descending to 214 where it sits today. "Close enough for government work," as the saying goes. Hitting this target sets up the next ABCD downleg, as this chart shows: 
Here we see the targets for the next stairstep down: 169 and then 100. (180 point move X .62 = 111, 280 - 111 = 169. 100% retracement = 280 - 180 = 100.) While screaming-head entertainers/pundits can call all the "bottoms" they want, even a cursory analysis of the HGX chart suggests the bottom is a long way down. Not shown on the chart is the third downleg, which will bring the index down to 50 or even lower. Impossible, you say? Recall the dot-com meltdown, if you will. Take a real company such as Akamai (AKAM) which ran to $348 at the height of the dot-com mania in early 2000. It subsequently fell to 56 cents in October 2003. If the housing sector continues to build unwanted inventory and dumps that inventory for losses, why would anyone buy housing stocks? For the land, which is depreciating rapidly? For the book value of deteriorating assets? I would say fair value of the housing index at the real bottom several years hence will be about 38. Give or take a few points; check back in October 2008 and we'll see where the index stands at that point. October 17, 2006 Getting Bond Yields (and interest rates) Right Yesterday I presented the essentials of what you need to know about the coming oil shortage. Please don't make up your mind on the topic until you've read the interview and the two books I provided. The facts are not as sanguine as the rah-rah crowd would have you believe. Just one factoid I have referenced in previous entries. Those Canadian tar sands which are our supposed "unlimited" energy savior? 1. We use 23 million barrels a day of crude oil. The maximum practical output of the Canadian tar sands complex is about 3 million barrels a day--1/3 of which is spoken for by the Chinese. So at best, we (the Canadians willing, of course) might draw less than 10% of our needs from the vaunted tar sands. 2. Mining and processing the gunk is horrendously costly and burns vast quantities of natural gas. It is not an efficient extraction of energy. 3. Mining and processing the gook creates environmental problems on a truly stupendous scale. I could go on and on but instead, why not just read the darn books? Ignorance is no substitute for knowledge, especially when it comes to investing. 
Today, let's look at the long-term direction of U.S. Treasury bond yields--the thing which ultimately sets mortgage and interest rates. Thanks yet again to frequent contributor Harun I., we have two fascinating charts to consider. At the risk of boring you financially savvy readers, let's cover a few basic realities of the Treasury bond market: 1. The Federal Reserve does not set mortgage rates or long-term interest rates; market forces of supply and demand set those rates. If global buyers willingly snap up all our bonds at 4% yield, then the Treasury doesn't need to raise the yield rates, and mortgage rates stay low, too. But if buyers stop buying bonds which yield 4%, the Treasury must raise the yield until buyers emerge. 2. Our government runs a massive deficit which must be funded by selling bonds. There is no Plan B, i.e. another source of funds to cover the deficit. Not only that, but there's over $4 trillion in existing debt which has to be constantly re-financed. The net result: our government must sell billions of bonds each and every month. If there is no buyer, the yield must rise. 3. The value of the bond is inverse to the yield. If interest rates jump 50%, the value of an existing bond drops 50%. Conversely, if interest rates plummet, the value of an existing bond rises. The reason is simple: why buy an existing bond that pays 5% when you can buy a new bond which pays 7.5%? 4. We as a nation have long been heavily dependent on foreign banks and entities buying up our debt/Treasury bonds. This makes us extraordinarily vulernable to political or financial changes in overseas appetites and willingness to buy U.S. Treasury bonds. This chart of the U.S. Treasury Bond Composite shows a massive wedge. As readers have gleaned from previous posts on the bond and on gold, wedges tend to break up or down in a major fashion. The recent action in this chart suggests the wedge has broken to the downside, i.e. the bond yield will continue rising in a long-term trend. What are the implications for a rising bond yield? Well, one is that mortgage rates will continue rising, effectively gutting what remains of the "housing boom." (More on that tomorrow.) If you're still a believer in the rah-rah cheerleaders' prediction that interest rates are going down and housing has hit bottom, check your enthusiasm at the door and consider this chart: 
Here is the wedge is a long-term perspective. As Harun notes, this could well be a "head and shoulders" formation, which in technical analysis is a pattern commonly found at a market top. He also observes that if this is the top, there are technical reasons for projecting a bottom which exceeds the previous low of October 1981, when yields hit 16%. The implication of this chart is rather profound: not only could interest rates rise, but there is the potential for the yield to exceed the previous high of 16%. For readers who are too young to remember the recession triggered by yields (and thus interest rates) rising to 16%, here is a synopsis: 1. The auto and housing industries were gutted, as no one could afford to borrow money. GM laid off 100,000 workers in one weekend. 2. Unemployment rose to over 10% officially; unofficially, i.e. counting all those who dropped off the statistical count after 6 months, it was on the order of 15%. 3. The stock and bond markets plummeted, as stocks could not compete with a 16% risk-free yield on plain old cash. The value of lower-yield existing bonds fell to the basement, wiping out much of the holders "safe investment." "That couldn't happen again." Oh really? Exactly why? The dollar and the bond are both perched rather precariously on the backs of the Chinese, Japanese and OPEC banks/investors. Should events conspire to weaken their desire to hold bonds (and thus the dollar), the yield would jump overnight. But wouldn't red-blooded Americans step up and buy trillions in Treasury bonds? Hahahahaha... with what cash? We have a negative savings rate! Would you suggest liquidating real estate to raise money... just as real estate dives in value? What would additional inventory do to prices? How about stocks? What would liquidating $2 trillion in stocks (to raise cash) do to the stock market valuations, especially if they're already dropping under pressure from a rising yield? And why buy a 30-year bond yielding 6% if it appears you could get 7% next month or even next year? A nightmare scenario, to be sure, but not out of the realm of possibility. As Harun noted: "I make no predictions; I follow the trend." Readers, please look carefully at the charts above before deciding interest rates "can only drop." October 16, 2006 Get Two Things Right and Wealth Will Follow  I have repeatedly alerted readers to the long-term consequences of declining oil reserves and
rising demands.
I have repeatedly alerted readers to the long-term consequences of declining oil reserves and
rising demands.
(Please see my archives and scroll right to the Oil/Energy Crises heading). Given that petroleum is the essential fuel of the global economy, get two things right and wealth will follow: the price of oil, and the flow of money. Today we turn to a respected oil industry analyst to state what has long been known by those paid to know: Oil supplies are in permanent decline, and oil demand will continue to grow even if demand softens in the U.S. due to recession. (Tomorrow we'll look at the other "gotta get this right if you wanna get rich" item: the global flow of money. This has a lot of moving parts--the dollar, commodities, bond yields, geopolitics, trade deficits (current account deficits), etc., so oil is the easier play to grasp.) It's real simple folks--the easy cheap oil is declining. Forever. But don't take my word for it--read what Mr. Maxwell has to say on the subject. Oil Prices: a Pause, Then Up-- Barrons Interview With Charles Maxwell, Senior oil analyst, Weeden & Co. In 1930 we found 10 billion new barrels of oil in the world and we used 1.5 billion. We reached a peak in 1964 when we found 48 billion barrels and used approximately 12 billion. In 1988, we found 23 billion barrels and used 23 billion barrels. That was the crossover when we started finding less than we were using. In 2005, we found about 5 billion to 6 billion and we used 30 billion. These numbers are just overwhelming.Despite the suspiciously coordinated hype from Exxon and Saudi Arabia about how there's unlimited oil left in the ground for your driving pleasure--a subject I covered last month in What's Up (Down) with the Price of Oil?--various stock analysts are sniffing around the energy sector, smelling "buys:" Some Battered Energy Stocks May Be Buys. 
 This chart of a popular oil index fund reveals the market is of two minds about energy at this moment in history. We see both a double top--suggestive of a long-term top in the market--and a double bottom, which suggests the downturn has run its course and prices will work their way back to the $60 resistance and then punch through to start a new upleg. (note that $60 here is the price of these index shares, not the price of crude oil.) Just in case you can't decide which way the price of oil will go, let me repeat this quote: "In 2005, we found about 5 billion to 6 billion and we used 30 billion. These numbers are just overwhelming." And two enlightening, information-packed books you might want to read: Twilight in the Desert: The Coming Saudi Oil Shock and the World Economy Beyond Oil: The View from Hubbert's Peak October 14, 2006 The Popularity of Consensus (or, how wonderful, you agree with me) One of the most popular features of the Internet is the sharing of users' reviews. I've relied on other consumers' opinions for wireless routers, DVD players, Las Vegas buffets, hotels in China and elsewhere--and I'm sure you have your own list. So popular is this "share your opinion" format that it has spread to ranking the news (digg.com) and sex workers in illegal brothels. According to a recent San Francisco Chronicle series on the trafficking of young women into America, Diary of a Sex Slave, call-girls can be ruined by poor online reviews just as effectively as restaurants or other services. 
Despite the appeal of "regular folks" reviews, the trend begs the question: are they actually accurate or useful? Or are they simply popularity contests? Are the top news stories on digg.com more important or more interesting than those chosen by editors at the Wall Street Journal or other major media publication? Are the rankings on digg.com "gamed" like the rankings on google.com? And if they can be (yes, they can), then exactly what is their validity? As a reader and reviewer on Amazon.com, I've noticed an unsettling trend. On amazon, not only can readers/viewers/consumers write an online review, but other users can rank the "helpfulness" of each online review. I've noticed that unfavorable reviews are judged unhelpful, while rave reviews draw nearly unanimous votes of "yes, this was helpful." You can go to my own reviews via my Amazon.com profile, or simply click on a couple of other reviewers' entire lists of reviews. Though this is only an anecdotal survey, it seems like even thoughtfully negative reviews draw far fewer user votes than glowing reviews, and at least half of those votes are rejections--that is, "no, this review was not helpful to me." So what does this say about online reviews? That we approve of everyone who agrees with us, and vehemently reject opposing opinions. This is unsurprising, but there are some other trends visible in this online opinion gathering. The most "popular" reviews (those with the most user votes on helpfulness) are pushed to the top, where they gather even more votes. Those reviews with less votes get buried in back pages where they will languish unread. Since reviews which are somewhat negative receive less votes, they are shoved to the back of the queue along with mediocre ("unhelpful") positive reviews. You see where this is going--we are drawn to reject opinions which differ from our own, and drawn to agree with the most popular opinions. In other words, we do not like views which challenge our belief systems, and despite our professed "objectivity," we are easily drawn into a herd mentality. Have online reviews been helpful to me? It's a mixed bag. The technology reviews have been complete busts. One guy rates the product zero, the next, a five (top rating). Reviews are wrong about product features, and don't explain what might have caused the product to fail (like, computer is unplugged, computer is loaded with trojan horse viruses, etc.) I have found film reviews on amazon to be generally more enlightening than those written by most professional reviewers. What's lacking in most reviews, of course, is the context of the film and a reasonable attempt to critique it rather than simply praise it. But a sharp critique will guarantee oblivion for your Amazon review, so the majority of reviewers write extremely positive reviews.  Amazon has some sort of algorithm which ranks reviewers (yet another ranking system), presumably
by the number of their reviews and their popularity. With 22 reviews and 76
"helpful" votes out of 83 total, I am ranked number 39,561 of Amazon reviewers. (Whoopie.)
"Top 10" reviewers have posted hundreds of reviews--how they do it is beyond my feeble
comprehension.
Amazon has some sort of algorithm which ranks reviewers (yet another ranking system), presumably
by the number of their reviews and their popularity. With 22 reviews and 76
"helpful" votes out of 83 total, I am ranked number 39,561 of Amazon reviewers. (Whoopie.)
"Top 10" reviewers have posted hundreds of reviews--how they do it is beyond my feeble
comprehension.
Isn't the stock market a similar "user ranking system," in which "popular choices" are purchased and hence rise in value, and views opposite our own beliefs are largely dismissed? It pays to read what you don't agree with, and look at evidence which isn't swayed by the "helpfulness votes" of others: data and charts. Curious about past entries? Either check my updated archives or use the nifty "search" box in the right sidebar. October 13, 2006 Friday the 13th: Bad Luck Bonds It is chillingly appropriate to look at a chart of the 30-year Treasury Yield Index (the so-called long bond) on Friday the 13th. Despite the widespread belief/hope/faith that interest rates will start falling, this chart says the opposite: long bond rates are in a new uptrend. 
Even a cursory glance at this chart reveals three critical technical points: 1. A very obvious double-bottom, which clearly marks the long-term low 2. A break above the declining trendline 3. An unmistakable new uptrend rising from May 2005 An astute reader sent me a link to the Guerite Advisors' Guerite Indicator which has accurately predicted every recession since 1960. Interestingly, this indicator began flashing "red" (high risk of recession) in May 2005--the same point at which the long bond transitioned from a multi-year downtrend into a new (and if history is any guide, multi-year) uptrend. Coincidence? I think not. Rising bond rates mean rising interest rates which means borrowing becomes more expensive. Rising rates are generally the death knell for equities (stocks) for the simple reason that when borrowing money costs more, consumers and businesses both spend less. Furthermore, as government borrowing costs rise, the government has to cut spending elsewhere or raise taxes to cover the higher interest payments. Either way, consumers and businesses--and thus stocks, which depends so heavily on rising profits and rising sales--all lose. And not just a little for a brief time, but big, and for many years. That's what this chart reveals; so which do you want to bet on? The "interest rates will drop" cheerleaders or the chart? Note: Amazon.com has added a neat "preview" feature to their links; go to my Recommended Books/Films page and mouse over any title. A preview box will appear with the title's "reader review stars" and other data. Check it out, it's kinda fun. Oh, and I updated the list, which now includes over 100 books and films. There's something for practically every taste, so take a look. October 12, 2006 How Now, "High" Dow? Frequent contributor Harun I. kindly provided the following charts to supply some additional context to the October 2 entry on the inflation-adjusted Dow Jones "high." As you recall, adjusted for inflation, the Dow Jones Industrial Average is well below its January 2000 record. In real dollars, the only "new high" that's been reached is in whatever the financial media pundits are smoking/imbibing, To put the anemic Dow "record high" in a more realistic perspective than that provided by nominal numbers alone (i.e., 11,800 is a new high because it is a higher number than 11,700), take a look at these charts. The first is the Dow in a ratio with the Dollar: 
The second is the Dow in a ratio with the Continuous Commodity Index, the replacement for the venerable CRB index: 
The conclusion: priced in either inflation-adjusted dollars or commodities, the Dow "record" is revealed as entirely bogus. For additional context on this "rising market" and "healthy economy," please read Harun's comments: �The bull forces were at work, and the public is never independently responsive to news. You see that all the time. If there is solid bull foundation, for instance, whether or not what the papers call bull manipulation is going on at the same time, certain news items fail to have the effect they would have if the Street was bearish. It is all in the state of sentiment at the time. In this case the Street did not appraise the extent of the catastrophe because it didn�t wish to.� Larry Livingston (pseudonym for Jesse Livermore),Thank you, Harun, for these illuminating charts and comments. I have nothing to add, as I concur completely. October 11, 2006 Google Buys YouTube: The Top Is In 
Google buys YouTube, which makes it Official: the top of this market is in. Pardon me while I have a heavy-duty flashback to 1997, when "push technology" was the hot trend and hundreds of millions were offered for its leading proponent, PointCast Network. So fervent was the belief/hype that Pointcast rejected a $450 million buyout. Here's the Wikipedia entry on "the rest of the story": The PointCast Network used push technology, which was a hot concept at the time, and received enormous press coverage. The product did not perform as well as expected, in part because its traffic burdened corporate networks with excessive bandwidth use, and was banned in many places... and people objected to the large number of advertisements that were pushed over the service as well. The client was eventually bundled with Microsoft Windows. At its height in 1997, the directors of PointCast reportedly spurned an offer of $450 million from News Corp for the company. They hoped to go public for a larger amount, but never did.Fast-forward to the present: Here we have YouTube, a 20-month old company with no patentable technology, no revenues except ads (i.e. no different than other websites with millions of users), and virtually no barriers to entry. Their sole enterprise value is name recognition and the "buzz" around downloading free videos. While the business press goes ga-ga over YouTube's 50 million users, does anyone note some rather obvious downsides, such as: 1. YouTube is fundamentally a huge time-sink with no productive value. Recall that truly revolutionary technologies enabled huge leaps in productivity and user value. For instance, the Apple Macintosh enabled small businesses everywhere to create professional graphics with easy-to-use software and a laserprinter. 2. There is nothing in YouTube that Microsoft or Yahoo! can't copy once the "buzz" wears off. Recall that Friendster launched the social network phenomenon but was soon overtaken by others. 3. Google is paying $32 per user for a site which sells ads. And exactly how well do Internet ads work? As a recent lead article in BusinessWeek describes, Click Fraud: The dark side of online advertising, the entire edifice of internet advertising rests on a compromised foundation. 4. "But look at all the potential revenue streams!" Yeah, right. Studios will pay gazillions to YouTube as users download TV shows and movies, blah-blah-blah. Did anyone notice that Apple has the model, brand, technology and CEO who can do this better than YouTube? What people like about YouTube is that it's free. End of story. 5. Exactly what will keep YouTube from being worth $7 million in a few years, when the recession has taken firm hold of consumers' shrinking pocketbooks, and internet ads have been revealed as ineffective, overhyped and overly expensive? Is there a truly compelling response? Subtract the hype and the hope, and you've got a classic flash-in-the-pan fad. And when one-year old fads command $1.65 billion, then it's official: the top is in. But take a look at this chart of Google for confirmation. There is a very dangerous wedge formation, which typically leads to a stock breaking up or down--usually down. Google's P-E ratio (price to earnings) is a very rich 62; a typical PE is 20, and a fast-growing tech company might trade at a PE of 30. Which means Google could drop in half to around $200 and still be fairly priced as a fast-growing tech conglomerate. The chart suggests such a drop is possible--and possibly even probable. October 10, 2006 Fortress of Denial 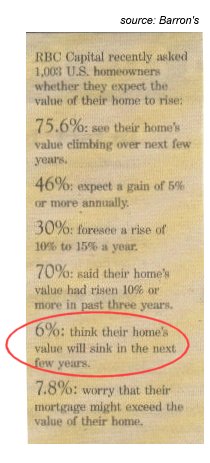 Consider, if you will, the general optimism (dare we say euphoria?) of homeowners
in these poll numbers from the current issue of Barron's.
Consider, if you will, the general optimism (dare we say euphoria?) of homeowners
in these poll numbers from the current issue of Barron's.
The operant phrase here is "state of denial," but this doesn't quite capture the robust, indeed, fortified nature of homeowner denial. I humbly suggest the more accurate term would be a Fortress of Denial--impervious to attack by reason, statistics or indeed any fact-based battering ram. Given the widespread stories in the media about declining sales and prices, it is truly remarkable that a mere 6% of homeowners--approximately the same number who believe the Earth is flat, and that oil has nothing to do with why we are in Iraq--anticipate the rather obvious consequence of declining prices: that my house, too, will decline in value. Isn't this reminiscent of the general optimism which reigned in the post-bubble decline of the Nasdaq in 2000-2001? As a trader/shareholder in a number of tech and Internet stocks, I recall with painful clarity how analysts of all stripes--and not just the known hacks and hypsters--predicted that the "bottom was in" around August 2000--two full years before the decline from 4,000 hit actual bottom at 1,100 in October 2002. Those were heady times, to be sure. In the months before the peak in March 2000, I bought some shares in a small semi-conductor company with the ticker HIFN for about $40 a share. To my glad astonishment, within a matter of weeks it had run to $105, at which point I sold. I would like to report I avoided the subsequent meltdown, but alas, I bought shares in doomed companies like Razorfish and Doubleclick "at the bottom" (August 2000, not the real bottom in October 2002), and suffered the fate of all hopeful shareholders in tech companies--gigantic losses. And unsurprisingly, we already hear voices calling "the bottom" in housing stocks: Whistling Past Housing's Graveyard? (Wall Street Journal) This will go down, I believe, as the analog of the market analysts' serene calls that Nasdaq "had bottomed" at 4,000 in fall of 2000--two years and 2,900 points too early. Let's look at some charts which suggest the bottom is nowhere in sight in the housing market: 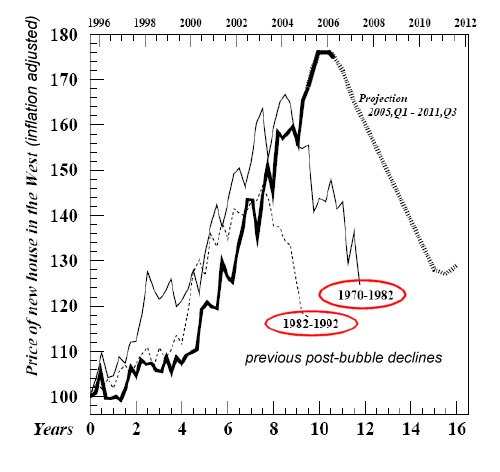
Check out this display of rising inventories--not exactly evidence that "the bottom" is in: 
"Values" are of course relative--but look at the evidence that appraisers have been pressured to jack up valuations in excess of reality: 
This fortress of denial will be breached not by a direct assault, but by a painfully slow, stone by stone dismantling. Judging by this poll, the reduction of the bubble's housing euphoria has barely begun. If you need more proof, then read this story in the San Francisco Chronicle (the newspaper I contribute to) about a 24-year old who bought eight houses in three states even though he is unemployed. No spin is used as blog describes downward spiral. Unbelievable? Not at all--this young gent is just one of thousands of "flippers/floppers" in today's "can't lose" real estate market. October 9, 2006 Tale of Two Debts/Deficits: Japan and the U.S.  One reads a great amount nowadays about how Japan has recovered from its "Lost Decade"
of deflation and financial malaise, but take a look at their Federal budget and tell me
this is a healthy government balance sheet.
One reads a great amount nowadays about how Japan has recovered from its "Lost Decade"
of deflation and financial malaise, but take a look at their Federal budget and tell me
this is a healthy government balance sheet.
How insane is the Japanese fiscal profligacy? Let me count the ways: 1. Fully 42% the government expenditures are financed with government bonds--i.e., borrowed from buyers of the bonds. This is deficit spending on massive scale. The U.S. government spends $2.4 trillion a year; 42% of those expenditures is about a $1 trillion. To equal the Japanese deficit spending, the U.S. would have to be running a deficit of $1 trillion-- about triple the current deficit of $300 billion. 2. A decade of such profligate deficit spending has created a staggering national debt, which costs the Japanese central government 18.4 trillion yen in interest payments--and this is in a nation where bonds pay a meagre 1% or so. Even at these absurdly low interest rates, Japan spends over 22% of its annual budget on interest on its national debt, even as it borrows another 34 trillion yen each year to the debt. $1 = 119 yen, so 34 T yen = $280 billion) 3. Japan spends 42% of its tax receipts (income) on interest payments alone; for Japan to actually balance its expenditures with income rather than borrowed money, it would essentially have to double its national tax receipts. (Note that Japan's GDP is about $4 trillion, compared to the U.S. GDP of $12.5 trillion. Japan has about 130 million citizens, while the U.S. has just topped 300 million citizens.) If the U.S. were to pay the equivalent percentage of its expenditures on interest payments, that would come to $528 billion--an astonishing sum. If Japan's runaway deficit spending and debt explosion is evidence of "fiscal health" and a "healthy economy," exactly what does a death spiral of debt look like? 100% deficit spending? In my book, borrowing 40% of your national buddget and devoting 40% of your tax receipts to interest on your national debt is fiscal insanity, not "health."  So does that mean the U.S. deficit and interest spending is benign? Hardly. The road to
ruin lies just ahead. As
The New York Times reported:
So does that mean the U.S. deficit and interest spending is benign? Hardly. The road to
ruin lies just ahead. As
The New York Times reported:
The government�s interest bill is expected to rise to $220 billion this year from $184 billion in 2005. In fiscal 2005, the government spent more on interest than it did on Medicaid ($182 billion). The Congressional Budget Office projects that the interest bill, after climbing nearly 20 percent this year, will rise 13.2 percent in 2007, to $240 billion, and more than 8 percent in 2008, to $270 billion. With each passing year, interest payments are likely to eat up a bigger chunk of total spending and crowd out other priorities.In other words: interest on our public debt already eats up 9% of U.S. government expenditures and over 10% of tax receipts, and can only rise as future deficits of $400+ billion a year keep adding to the total debt. And if interest rates rise to a historically typical range of 6 to 9% from today's 4.5%, then the costs of debt service could skyrocket. Here is the Treasury's accounting of the current national debt: debt to the penny and who holds it Here is the Treasury's accounting of the current interest expenses: interest expense ($400 billion) Why does the chart say $217 billion and the Treasury say $400 billion? The difference is the interest the government pays itself, more specifically, its trust funds like FICA (Social Security). The Federal government "borrows" all the money collected in Social Security taxes and promptly spends it, giving the Trust Fund an IOU for the funds. The $200 billion interest goes to these government trust funds. So while this $400 billion is technically accurate, what should really worry us is the interest paid to external, non-government owners of public debt, many of whom are foreign central banks or investors. "Deficits don't matter" is a mantra of the current administration. Oh really? Spending 10% of your income on interest and borrowing 12 - 15% of government expenditures doesn't count? Spending more on interest than on Medicare doesn't count? When does it count? When it's larger than Defense ($529 billion)? The not-so-visible difference between Japan's debt and the U.S. debt is that the Japanese are prodigious savers, and can fund their own debt internally. In other words, as long as the Japanese save 20% of their national income, then their individuals, insurance companies and banks can buy their government's 34 trillion yen in bonds and cover the annual deficit more or less indefinitely. But here in the U.S. we are saving -1% --yes, a negative savings rate for the first time since the Great Depression. We don't generate sufficient savings to fund our own government's deficits. We rely on foreigners to buy at least half of all outstanding Treasury bonds-- over $2 trillion, not counting OPEC money which flows in from London or the Caribbean and thus isn't counted as central bank ownership. Bottom line: the Japanese can continue running such staggering deficits because they can fund them with their own savings. The U.S. does not have that luxury. So what happens if for political or financial reasons, foreign investors and central banks stop buying U.S. bonds? Interest rates will have to rise to the point that someone steps up and willingly slaps down their cash for a fixed rate of return from the U.S. Treasury. Just because investors have been willing to do so for years doesn't make that a guaranteed bet. To count on what you don't control to fund your deficit and keep your interest payments low is the purest form of folly. October 7, 2006 Trust VI: Trust, Maturity and Faith: Yojimbo and Heart of the Matter  Yojimbo is a vastly entertaining action film with all the elements of that genre: fast pace, surprising plot turns, and a justly famous samurai showdown. But the central theme of the film is the difficulty of properly assessing trust and mistrust, and how the ability to do so is an essential feature of maturing from idealistic youth to seasoned adult. The plot setup is straightforward: nine idealistic samurai youths band together to clean their clan of corruption. The chief administrator is unsympathetic and thus earns their distrust. The friendly chamberlain is keen to help, and they are enthusiastic in their praise of him. Full of trust, they agree to meet him at an abandoned house. Unbeknownst to them, a wandering ronin (masterless samurai) played by the peerless Toshiro Mifune, has been sleeping in the back room, listening. They don't trust him at all, of course, even as he ascertains that the chamberlain is untrustworthy and plans to have them killed. Sure enough, dozens of armed men appear outside and only Mifune's quick thinking saves the young idealists from a sure death. Despite his obvious skills in parsing out who is trustworthy and who is not in the shifting loyalties and politics of the clan, the young hotheads continue to distrust Mifune; this desire to make those calculations themselves leads again and again to near-disaster. Each time, Mifune's experience and moxie enables him to evade far superior forces. At the film's conclusion, trust of another sort takes the stage. The evil samurai who was the corrupt chamberlain's right-hand man, played by the great Tatsuya Nakadai, feels that Mifune's manipulation of his trust was treachery of the blackest sort. Mifune explains that he had no choice but to mislead Nakadai (the details I will leave to the film). Nakadai says he cannot rest easy, and demands the satisfaction of a sword duel to the death. This is rich moral territory. So misleading the idealistic in order to eliminate them is treachery, but then so is misleading the evil servants of corruption--if you are the evil servant. But from the point of view of our hero, the false trust/treachery was simply an unavoidable part of saving the young idealists from destruction. By the film's end, the young idealists now appreciate Mifune's ability to sort out who deserves trust. This skill comes only with experience and maturity, and they have received a master class in trust from a rough-talking, uncouth ronin--one of the film's many sly ironies.  The local chief of Police, an Englishmen, has overstayed his tour of duty--"gone native," as the saying goes. He has grown wise in the ways of the local tribespeople, and no longer attempts to impose a British version of "justice" on their squabbles and petty corruption. His wife loathes the place, but he is quite satisifed with his position. He was in line for the top colonial administration post, a step up his wife longs for, but he is passed over. Here, too, the central issue is: who do you trust? Various Arab traders are smuggling diamonds out of the colony, and all police attempts to discover the methods come to naught; the police are suspected of being "on the take" and the wily traders do in fact offer a variety of bribes. Our hero is honest, but is suspected of being dishonest. In his wife's absence, our hero has the misfortune of falling passionately in love with a younger Englishwoman who is marooned in the colony. This sets up the story's central conflict: both women trust him, and yet he has to abandon or lie to one. Which one? This moral dilemma--which bond of trust to break--is unresolvable. At one point in the book, a character considers suicide as an escape from the cruel grip of a moral double-bind. But killing oneself is a mortal sin and against God's wishes; but then, isn't God forgiving? Which can the character truly trust? The church's rule that suicide is unforgivable, or God's limitless forgiveness of all sins, once one repents? Exactly how deep is your trust in God's forgiveness? It is only when the burden of sin is great that you really ponder what faith and trust in God really mean. October 6, 2006 Do You Trust this Market Rally? For your consideration--three charts of The Dow Jones Industrial Average: the Great Depression Bear Market 1929 - 1946, the Bear Market 1966 - 1982 and the present. 
Do you see a rather obvious pattern in all three cases? A seven-year "recovery" period from a Bull Market top ends in a dramatic cliff-dive, launching a 10-year Bear Market in which the market, adjusted for inflation, either declines or declines precipitiously. Rather ominously, we are very near the 7-year mark in this glorious "recovery." But why oh why would this outstanding prosperity end so abruptly when all the metrics so beloved of pundits are so robust? To wit: unemployment (low), inflation (practically zero), interest rates (low and set to fall), wealth (rising), stock market (up), real estate (up for a decade), oil prices (dropping). I would submit that all that is nice, but it rests on shaky foundations: 1. An unprecedented housing bubble which is just beginning a multi-year decline to unforeseen depths and financial losses for all participants. 2. An unaffordable, inefficient and morally corrupt (i.e. 46 million uninsured and another 50 million with lousy coverage or coverage which hangs by a thread) "healthcare system" (more like an "illness archipelago") which is poised for either collapse or revolution, take your pick. 3. Federal and local government deficits and/or unfunded liabilities (entitlements, rich public union employee pension plans, etc.) which are set to explode. 4. $265 trillion in "risk-free" derivatives--20 times the entire U.S. economy and five times the global economy--are about to be revealed as a stupendous risk. From The Economist:5. A structural Federal deficit largely funded by foreign central banks and investors is about to be revealed as a liability beyond our control. 6. An unprecedented (7% + of GDP) structural trade deficit/current account deficit is about to be revealed as an unsustainable system whose breakdown will have unfortunate consequences for the dollar and the American lifestyle of endless consumption on someone else's (borrowed) dollar. In summary: the tenuous equilibrium in these unstable systems is near the breaking point. History suggests an almost Biblical pattern of 7 years of post-peak stability will end with a collapse in stocks (and maybe bonds, too, this time around) and a decade-long recession/period of financial malaise/decline. Ignore it at your own risk; think "capital preservation," please. And while we're on the stock market, a lagniappe: here's an oh-so-truthful (at least in my experience) haiku on the market by my good friend Steve T.: when it comes to stocks I coulda shoulda woulda done the opposite October 5, 2006 Our (Mis)Trusted Financial Regulators Frequent contributor Albert T. alerted me on September 27 to several obscure yet important regulatory changes which affect lending practises. Re: The Financial Services Regulatory Relief Act of 2006: Senator Crapo's website description of the bill and marketwatch's story. 
I will confess that the consequences of these changes seem much harder to assess than the recent regulatory changes which "tighten" the incredibly lax standards of "no document" loans (e.g. I tell you I make $200K a year and you write the mortgage without asking for any documented evidence of my income). Given today's feeding-frenzy mortgage market (i.e. the predatory lenders/piranhas are feasting on fat, dumb and soon-to-be unhappy borrowers, banks are loading up on mortgage debt, etc), the salient points are:
1) The extremes in the current lending/mortgage/real estate markets are unprecedented. As this chart of bank reserves reveals, the risk of lenders being unable to cover losses due to foreclosure or non-payment of loans is high, as their reserves against losses have fallen to all-time lows. The chart above shows that bank assets are now heavily concentrated in mortgages, making them very vulnerable to any downturn in the value of housing and/or borrowers' ability to keep making payments. Yet regulators are, eight years into the housing boom, still doing next to nothing to limit these appallingly obvious risks. 2) Regulations are tweaked all the time, as these new regs show, so there are simply no excuses for either regulators or lawmakers to have ignored these lending risks for eight long years 3) Not all regulations actually aid consumers; in some cases, easing regulatory burdens may lower costs and enable a more competitive market for financial services but do nothing to protect consumers from misleading practises 4) The regulations governing lending, loan reserves and mortgage origination are complex and operate across a number of regulatory agencies 5) "Caveat emptor" (buyer beware) is always a good idea, but loan documents of 30+ pages provide plenty of opportunities to mislead a typical non-attorney borrower. Just as buyers of used cars cannot be expected to be experienced mechanics who could spot hidden trouble spots in a car, borrowers deserve regulatory protection from predatory rates and penalties as well as from subtle forms of misleading or purposely obscured information--tiny print, critical data buried in pages of legalese mumbo-jumbo, etc. 6) Given the high number of non-traditional loans which have been written in recent years, regulators have clearly been asleep at the wheel. 
7) As the above chart from the FDIC reveals, that agency has long known that subprime and exotic/non-traditional mortgages like option ARMs present grave risks to the nation's least-secure borrowers. Yet only now, eight years into the housing bubble, are the most egregious lending excesses being reined in. Talk about closing the corral gate after the horses have thundered out... Let me state what I believe is the fundamental reality of this gross regulatory mismanagement: consumers are only protected from predatory practises when the situation grows from a regulatory problem into a political problem. I think this sudden rush of regs to limit the worst lending practises is a 9th-inning attempt to "inoculate" the regulatory agencies from the fully justified accusation that they did nothing while the U.S. lending industry ran amok. The inoculation will fail as rock-ribbed Republican voters start getting foreclosure notices, gigantic ARM re-sets, higher property taxes bills, etc. At that point, the politicians will be forced to appear concerned, and a raft of heavy-handed and probably misguided regulations will be passed "to fix the problem." But their "fix" will be far too late, as the damage has been accumulating for years. The fallout will be neither brief nor pretty. October 4, 2006 Trust III: The Con in Confidence ...and readers' haiku A number of readers responded to the weekend haiku challenge, and I am delighted to share their creative efforts. Each one cleverly captures/expresses a key insight: Bummer I lost my house!Thank you, reader/poets, for these bright witty creations. Each poet wins a free copy of my novel I-State Lines, for how could I pick just one from such field?  This is not an easy book to read for several reasons. First, it is undoubtedly one of the first "post-modern" novels which breaks from traditional narrative storytelling. ( Another example: Dostoevsky's Notes From the Underground.) The Confidence-Man is a collection of 45 conversations between various people on the riverboat--beggars, absurdly dressed frontiersmen, sickly misers, shysters, patent medicine hucksters, veterans (of the Mexican-American War) and the "hero" in the latter part of the book, the Cosmopolitan. In typical Melville fashion, you also get asides--directly to the reader, in several cases, as if Melville felt the need to address issues of fiction outside the actual form of his novel. The lack of structure, action and conclusion make this a post-modern type book, but if you read each conversation as a separate story, then it starts to make more sense. For what ties the book together is not a story but a theme: the nature of trust and confidence. In a very sly way, Melville shows how a variety of cons are worked, as the absolutely distrustful are slowly but surely convinced to do exactly what they vowed not to do: buy the "herbal" patent medicine, buy shares in a bogus stock venture, or donate cash to a suspect "charity." In other chapters, it seems like the con artist is either stopped in his tracks or is conned himself. Since the book is mostly conversations, we are left to our own conclusions; there is no authorial voice wrapping up each chapter with a neatly stated ending. This elliptical structure conveys the ambiguous nature of trust; we don't want to be taken, but confidence is also necessary for any business to be transacted. To trust no one is to be entirely isolated. Melville also raises the question: is it always a bad thing to be conned? The sickly man seems to be improved by his purchase of the worthless herbal remedy, and the donor conned out of his cash for the bogus charity also seems to feel better about himself and life. The ornery frontiersman who's been conned by lazy helpers softens up enough to trust the smooth-talking employment agency owner. Is that a terrible thing, to trust despite a history of being burned? The ambuiguous nature of the bonds of trust is also explored. We think the Cosmopolitan is a con-man, but when he convinces a fellow passenger to part with a heavy sum, he returns it, just to prove a point. Is that a continuance of the con, or is he actually trustworthy? The book is also an exploration of a peculiarly American task: sorting out who to trust in a multicultural non-traditional society of highly diverse and highly mobile citizens. In a traditional society, things operate in rote ways; young people follow in their parents' traditional roles, money is made and lent according to unchanging standards, and faith/tradition guides transactions such as marriage and business along well-worn pathways. But in America, none of this structure is available. Even in Melville's day, America was a polyglot culture on the move; you had to decide who to trust based on their dress, manner and speech/pitch. The con, of course, works on precisely this necessary reliance on one's senses and rationality rather than on a traditional network of trusted people and methods. So the con man dresses well and has a good story, and an answer for every doubt. What does all this mean for us today? Simply this: we are in the golden age of the Big Con. The entire real estate industry--supposedly as American as Mom and apple pie, the roof over your family's head, your nestegg, etc. etc. is resting on a now-crumbling foundation of mortgages based on lies to the lender (yes, I make $100,000 a year), and deceptions passed onto the borrower (you can re-fi later into a fixed rate. Oops, forgot to mention the penalty, didn't we?). The stock market rests on profits which are often nothing but fabrications ("before we deduct expenses, why we're immensely profitable!") and accounting chicanery. Our Federal Government soaps the numbers in all sorts of ways, starting with a manipulated inflation rate, a budget which hides future obligations and a method of accounting which includes tricks like putting heavy costs into the next fiscal year in order to artificially reduce the apparent deficit this year. The list goes on, but we all know that the finances of our nation are spun and manipulated to benefit the spinners. This includes local governments, the housing industry, the financial industry, Fannie Mae, the Federal government, you name it. The solution? Well certainly a good first step is to recognize the con, and accept that we've been conned, and accept that buying into the con made everyone feel warm and fuzzy. That's the point of a con, isn't it? Too bad reality can't be conned; only people can be conned, and the Great American Pastime--the financial con, not baseball (though that's a con, too)-- looks like it is about to spin out of control. Oh, and the second reason why Melville is hard to read is his long, leisurely, clause upon clause sentences. But the book is also peppered with his sly humor, which sneaks up on you... well, just like a good con. October 3, 2006 Trust II: Are Business Ethics Also Hitting "New Highs"? One of our site sponsors, Ronald Dump Enterprises, has a new seminar for everyone seeking that corner office in the executive suite: 
1. Option backdating. You've heard about backdating options for execs who had the misfortune to pass away before exercising their plump option package... we'll show you how to pull the same trick for your as-yet unborn children. That way, your little tyke can exercise the options well before kindergarten. Now that you're tempted to enroll in Dump's astonishing seminar, ask yourself: Have some companies always cooked their books? Of course. Has the media glossed over corporate scandals? Yes. Have executives been granted rock-star adulation and "compensation packages" in the tens of millions? Uh, no. Have corporate balance sheets always been allowed to use "non-recurring expenses" and other slight of hand to appear profitable? Uh, no. Has short-term hyper-speculation always been encouraged over investment? Uh, not always. It seems self-evident that manipulation of data, rampant speculation and media-savvy spin is pervasive and accepted as "normal" to an unprecedented degree in corporate America. Are "business ethics" hitting a new "high" along with the Dow Jones Industrials? Or is the "high level of corporate ethics" just as bogus as the new "high" in the DJ-30? (See yesterday's entry for the puncturing of that claptrap.) Is there a better way? There is. Let's turn to an alternative way of rewarding executives--one more attuned to investment as opposed to manipulation and speculation. Our U.K. correspondent made an interesting suggestion on how to encourage investors rather than speculators--tie executive options to the company's long-term prospects: I feel you are correct when you say that the shareholders are speculators not investors. The ultimate example of which are the day traders - absolute speculation tantamount to gambling. So at what point does speculation become investment? I would say it is highly correlated to the length of time the shares are held.A Thought-provoking idea, to be sure. And one with ethical ramifications as well. October 2, 2006 This Week's Theme: Trust/Confidence We've got a fun and fact-filled week here at oftwominds.com, all centered on the theme of trust/confidence. My commitment to you, dear reader, remains the same: no ads (except spoofs) and a not quite predictable mix of content. OK, let's get to work. Internet friend S.P. asked me for my view on the U.S. stock market, and my response begins with this question: "How much confidence can we place in the data we are presented?" The short answer: as far as you can throw an Elephant (or for that matter, a Donkey.) Let's start with those utterly bogus new home sales. As Alan Abelson noted in his UP AND DOWN WALL STREET column in the current issue of Barrons: The only reason (new home) sales were higher, as Northern Trust's gimlet-eyed Asha Bangalore points out, is that there were ponderable downward revisions to the previous estimates of new home sales in May, June and July. If the original estimates for July were unrevised, August would have shown a decline of 2.1%, instead of a rise of 4.1%.Could this manipulation be any more blatant? Compare apples (current data) to oranges (revised data) or whatever it takes to conjure up a "positive-spin" housing sales report. The sales figures are bogus for another reason: cancellations are never recorded or deducted. With cancellation rates running at 30% - 40%, exactly how many of these "new home sales" actually close? No one knows, but it's certainly a much lower number than the sales number--as reported in Bloomberg: Simply put, cancellations are rising, and they aren't being captured in the aggregate statistics because of the way the survey is designed. Hence, sales are being overstated and inventories understated.Next up: that phony-baloney "Dow Jones Industrials record high." Nice--but what about the 18% inflation since the 11,722 record was reached in 2000? Rather conveniently forgotten, isn't it? Let's face it: this DJ-30 "record" is as bogus as they come. First go to the Bureau of Labor Statistics Inflation Calculator and plug in $1 in 2000 and you find that you need $1.18 in 2006 to equal that buck in 2000. Therefore, to reach an inflation-adjusted new high the Dow would need to rise above 13,880. Reaching the record of 11,722 in 2006, once adjusted for inflation, leaves us not with a record but an abysmal 18% decline in the value of our portfolio. But have your read even one mass-media pundit who mentions inflation in conjunction with this utterly fake "record"? 
Frequent contributor Harun I. has graciously supplied this chart of the Dow priced in gold rather than dollars. The "new record" story looks quite a bit different here. Priced in gold, the Dow has plummeted more than 50% from its Augsut 1999 record (in ounces of gold). So where's our new Dow record? I guess in the same Fantasyland where inflation is near zero. 
Harun was also kind enough to send along a chart of the Dow Jones Industrials with trader data. Here is his commentary, which I suggest you read closely: Here is the Dow Industrials with all three groups of traders as classified by the CFTC. What is important to note here is the level of net percent holdings by group. Commercials: 38.2% net short, Non-Commercial (Large Traders): 8% net long, Non-reportable (Small Traders) 30.2 % net long.There are a number of influential folks who would dearly like to see the "rally" extend to November 3 (for instance, those incumbents running for Congressional offices). But it remains to be seen if their pals will keep buying the "rally" to goose it along until the incumbents are duly re-elected on a platform of "lower gasoline prices and continued prosperity, as proven by the new Dow record high." Or, maybe even the "Plunge Protection Team" won't be able to maintain air pressure in this phony Dow "record." Note that the market historically drops 10% after the Fed's last interest rate increase (Cue the menacing music). The fact that the Dow failed to close above its previous "high" on three intraday attempts last week is also rather bearish. Speaking of gasoline prices: have any of you done this math? Decline in oil: $78 to $60/barrel, a drop of 23%. Average price drop in gasoline: 66 cents/gallon, or 33%. Isn't it interesting that gasoline dropped significantly more than the price of crude oil? "Market forces" at work? Yeah, sure, pal. As if the buyers of gasoline wouldn't have been thrilled with a mere 23% decline in gasoline prices. So why the extra 10% drop? The famous compassion and generosity of oil companies? (Hahahahahahaha....) Or could it be related to the rising popularity of office holders every time gas prices decline? Hmmm.... Please browse this month's entries and the archived wEssays listed in the sidebar. If nothing here strikes your fancy, skim through my recently published articles (generally in the San Francisco Chronicle) and my archives back to 1995. I would be honored if you link any essay to your website, print a copy for your own use or add my RSS or Atom feed. And of course I appreciate your recommendations of this weblog and your comments: csmith@oftwominds.com. wEssay noun, combination of 'web' and 'essay,' denoting a short online essay which exploits the hyperlinks, interfaces and interactive capabilities of the World Wide Web; coined by Charles Hugh Smith on May 1, 2005, in Berkeley California. Aphorisms I live by: "May a fair road always be open to you." (CHS, April 2, 2006) The way of the Tao is reversal." (Lao Tzu) "Chance favours the prepared mind.� (Louis Pasteur) All content and images copyright © 2006 Charles Hugh Smith, All rights reserved in all media, unless otherwise credited or noted. |
|

Subscribe via RSS: search my site:
Worth Visiting:
ilind.net Mish's Global Economic Trend Analysis Marin Real Estate Bubble View from Silicon Valley Rick's Picks Gold Eagle Econotech PennyJar Satellite Sky myrealestate bubble.com articles and eBook and blog John Francis Kinsella author/painter Letter from Basque Country buy my novel I-State Lines at The Kaleidoscope (indie bookstore, free shipping) Or from amazon.com: I-State Lines |
|
Our retail policy: Nothing is for sale except books/films I recommend and my own novel I-State Lines (via links to Amazon.com and The Kaleidoscope: Our Focus Is You independent bookstore) Free alternative: find them at your local library. |
home |
 Weblog and wEssays


